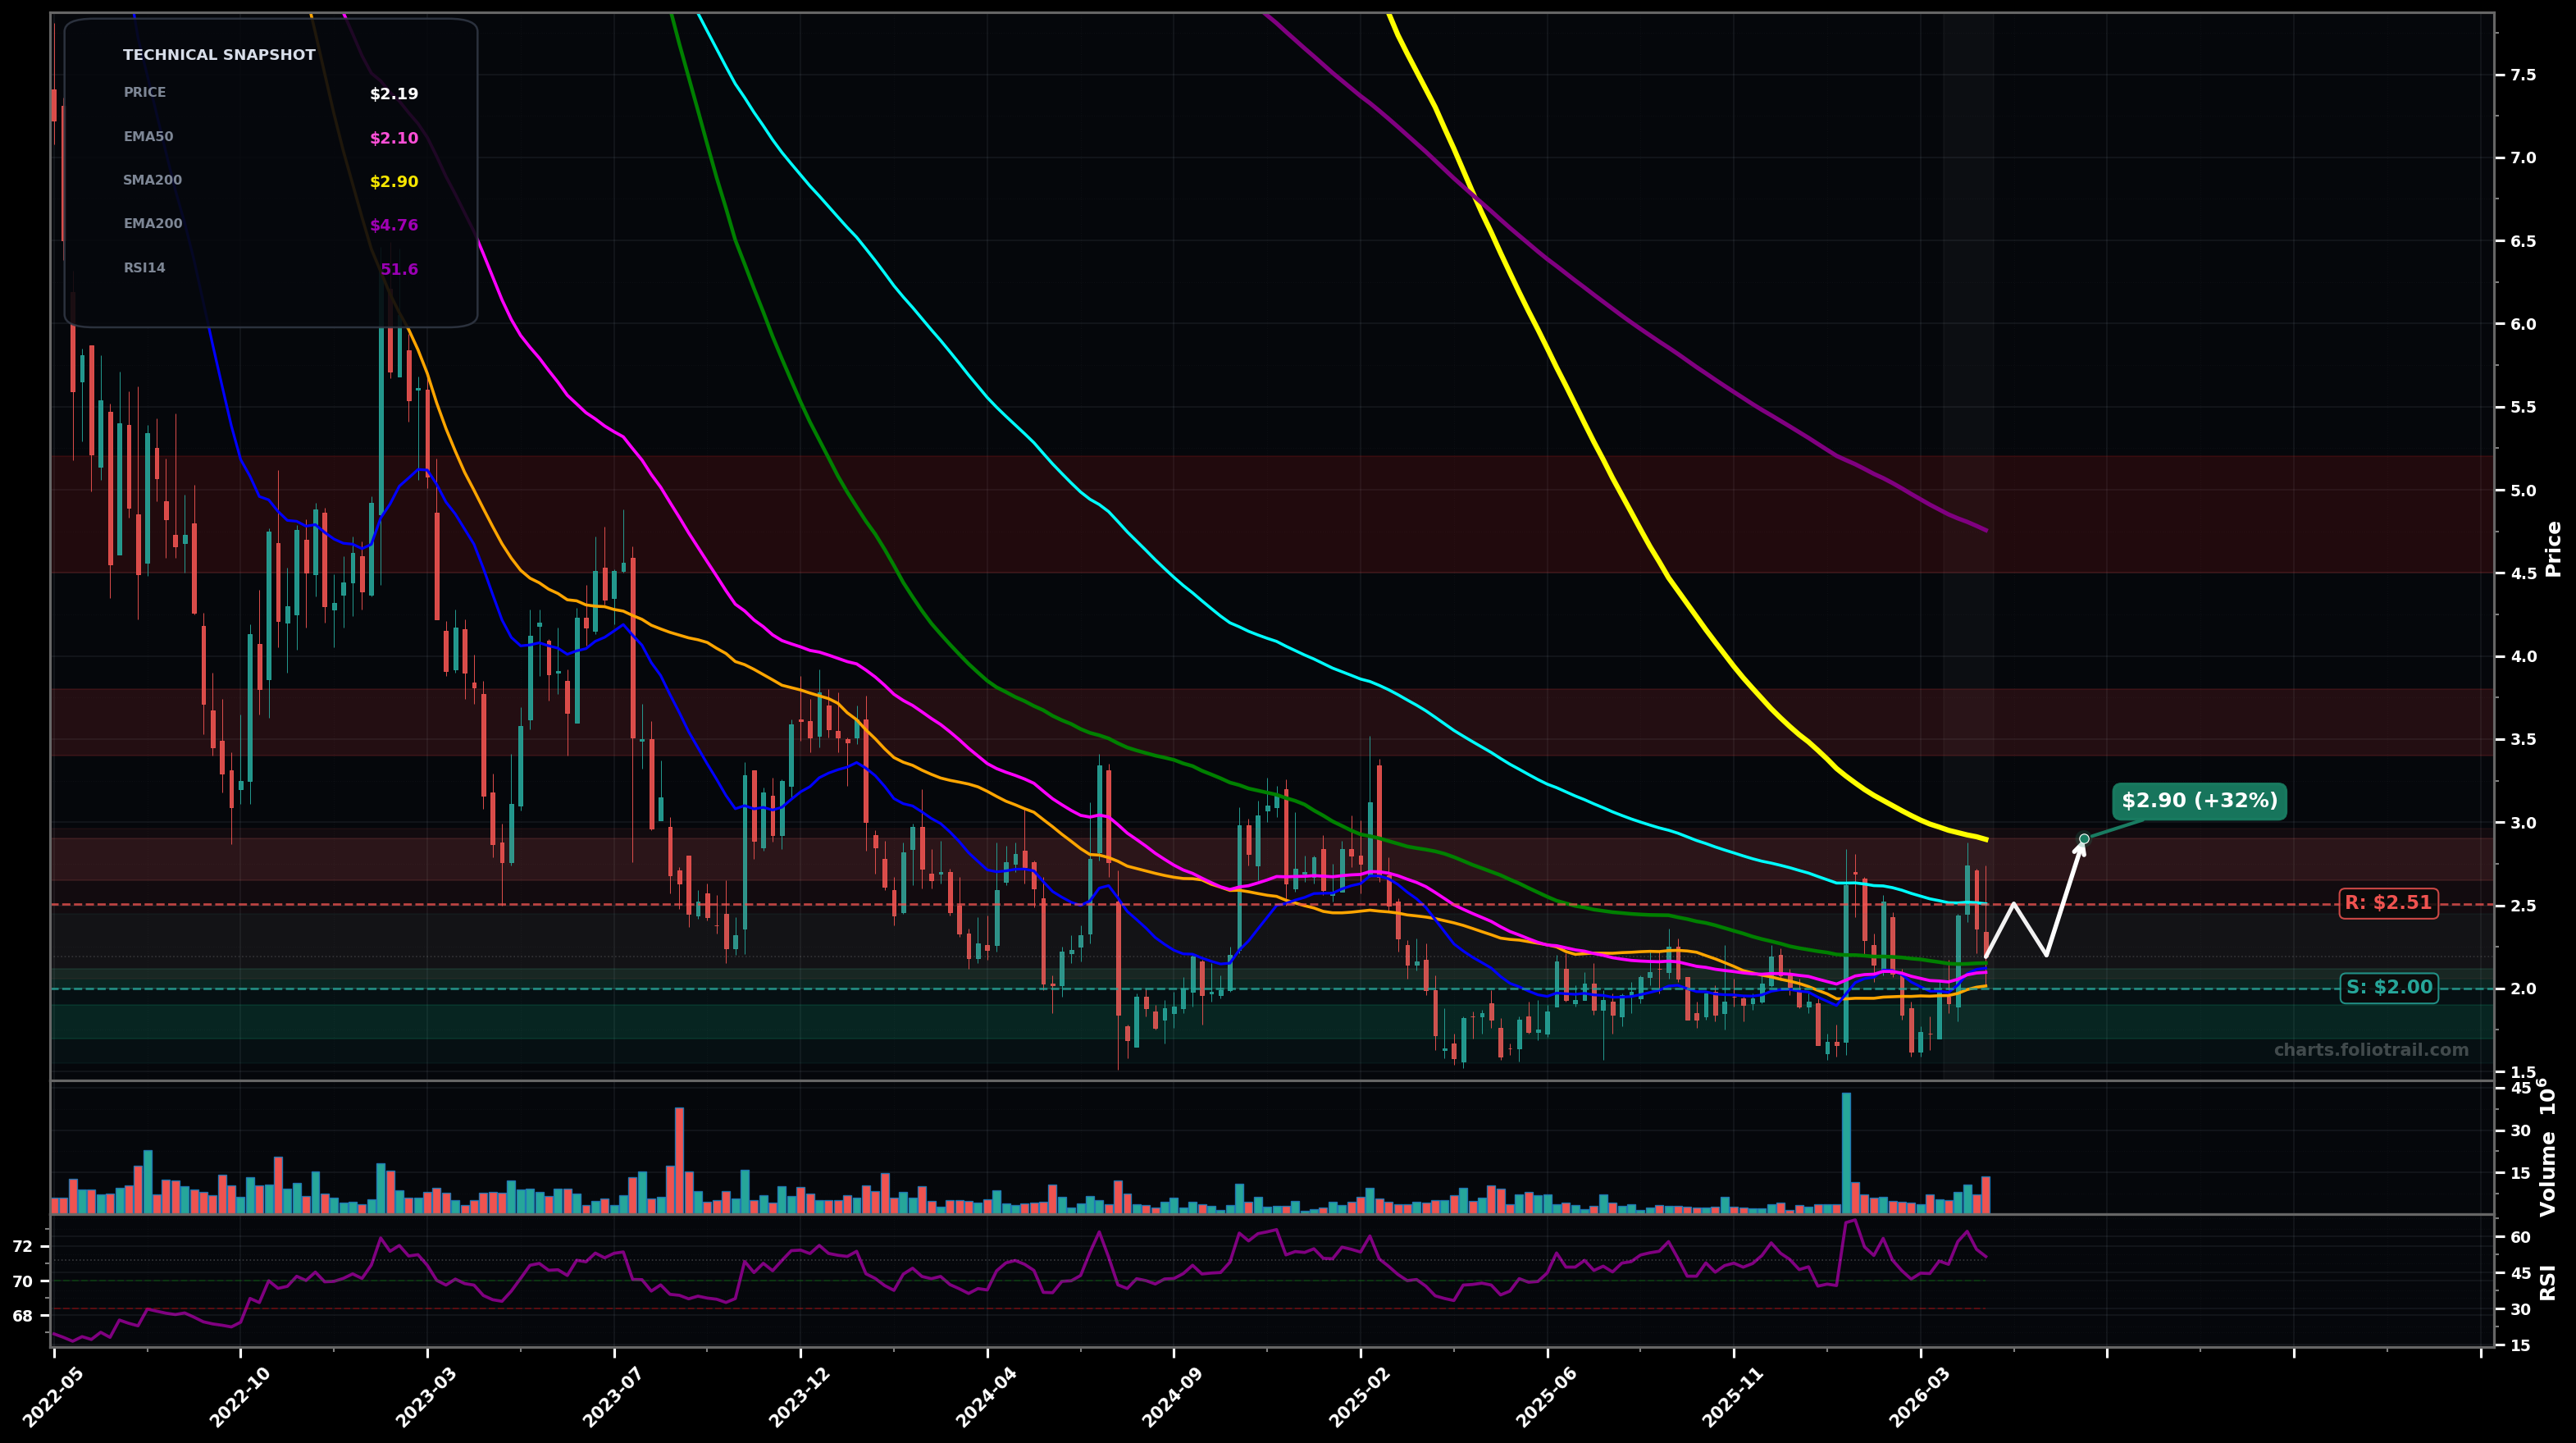
As of May 22, 2026, EGHT (8x8 Inc.) is in a choppy range state on the weekly chart, with a confidence level of 67%. Key support is at $2.00 and key resistance at $2.51. Weekly price ~$2.19 is basing above ~$2.00–$2.10 (SMA50/EMA50 area) after a volume spike and a quick rejection near ~$2.65; RSI ~51 (neutral).
Range continuation with mild bullish bias: hold $2.00–$2.10, grind up to re-test EMA100 (~$2.51); if accepted, squeeze toward prior supply near ~$2.65–$2.90 (SMA200). (Elliott: base building as a potential wave (2)/(B) before an impulsive attempt; Fib: $2.50 is a typical 38.2–50% reclaim zone of the last downswing.)
Bearish rejection at $2.50–$2.65: fail to reclaim EMA100, roll over back into the range and break $2.00, triggering a liquidity sweep toward the prior swing low zone (~$1.70–$1.55). (Elliott: could be a wave (C)/(3) continuation lower if support snaps.)
2+ weekly closes above $2.51 (EMA100) would confirm a breakout-reversal attempt
Weekly close below $1.90 would invalidate the range/base and reopen breakdown risk
Start near range support/EMA50 confluence; add on breakdown-to-support conversion attempt; heavy add only at prior swing-low demand where risk/reward improves.
Trim into major overhead supply (recent spike high then SMA200); heavier trims into mid-cycle resistance; close into EMA200/major long-term downtrend band where mean-reversion is likely.
As of May 22, 2026, EGHT (8x8 Inc.) is in a choppy range state on the weekly chart with 67% confidence. Weekly price ~$2.19 is basing above ~$2.00–$2.10 (SMA50/EMA50 area) after a volume spike and a quick rejection near ~$2.65; RSI ~51 (neutral).
On the weekly timeframe, EGHT has key support at $2.00 and key resistance at $2.51. The most likely scenario (bullish) targets $2.51 and $2.90, with a revert level at $2.20.
EGHT (8x8 Inc.) is currently classified as choppy range on the weekly chart, with 67% confidence. Confirmation requires: 2+ weekly closes above $2.51 (EMA100) would confirm a breakout-reversal attempt This would be invalidated by: Weekly close below $1.90 would invalidate the range/base and reopen breakdown risk
The most likely scenario (bullish) targets $2.51 and $2.90, with a revert level at $2.20. The alternative scenario (bearish) targets $1.70 and $1.55.
Multi-layer AI agents analyse 200+ stocks across daily, weekly, and monthly timeframes — producing market state classifications, price scenarios with targets, and position entry/exit levels. Daily charts updated every trading day at 6 PM ET. Weekly charts refresh Fridays. Monthly charts refresh on the last trading day of each month. No paywall. No sign-up required.
Built by Foliotrail.
All content on this website — including charts, analysis, price targets, support/resistance levels, and position zones — is generated entirely by AI and provided for educational and informational purposes only.
This is not financial advice. NEXUSNOIR VENTURES SL (the operator of this website) is not a registered investment adviser or broker-dealer. You should not make investment decisions based solely on this information. Always do your own research and consult a qualified financial advisor.
By continuing, you acknowledge that you have read and agree to our full disclaimer & terms of use and privacy policy.