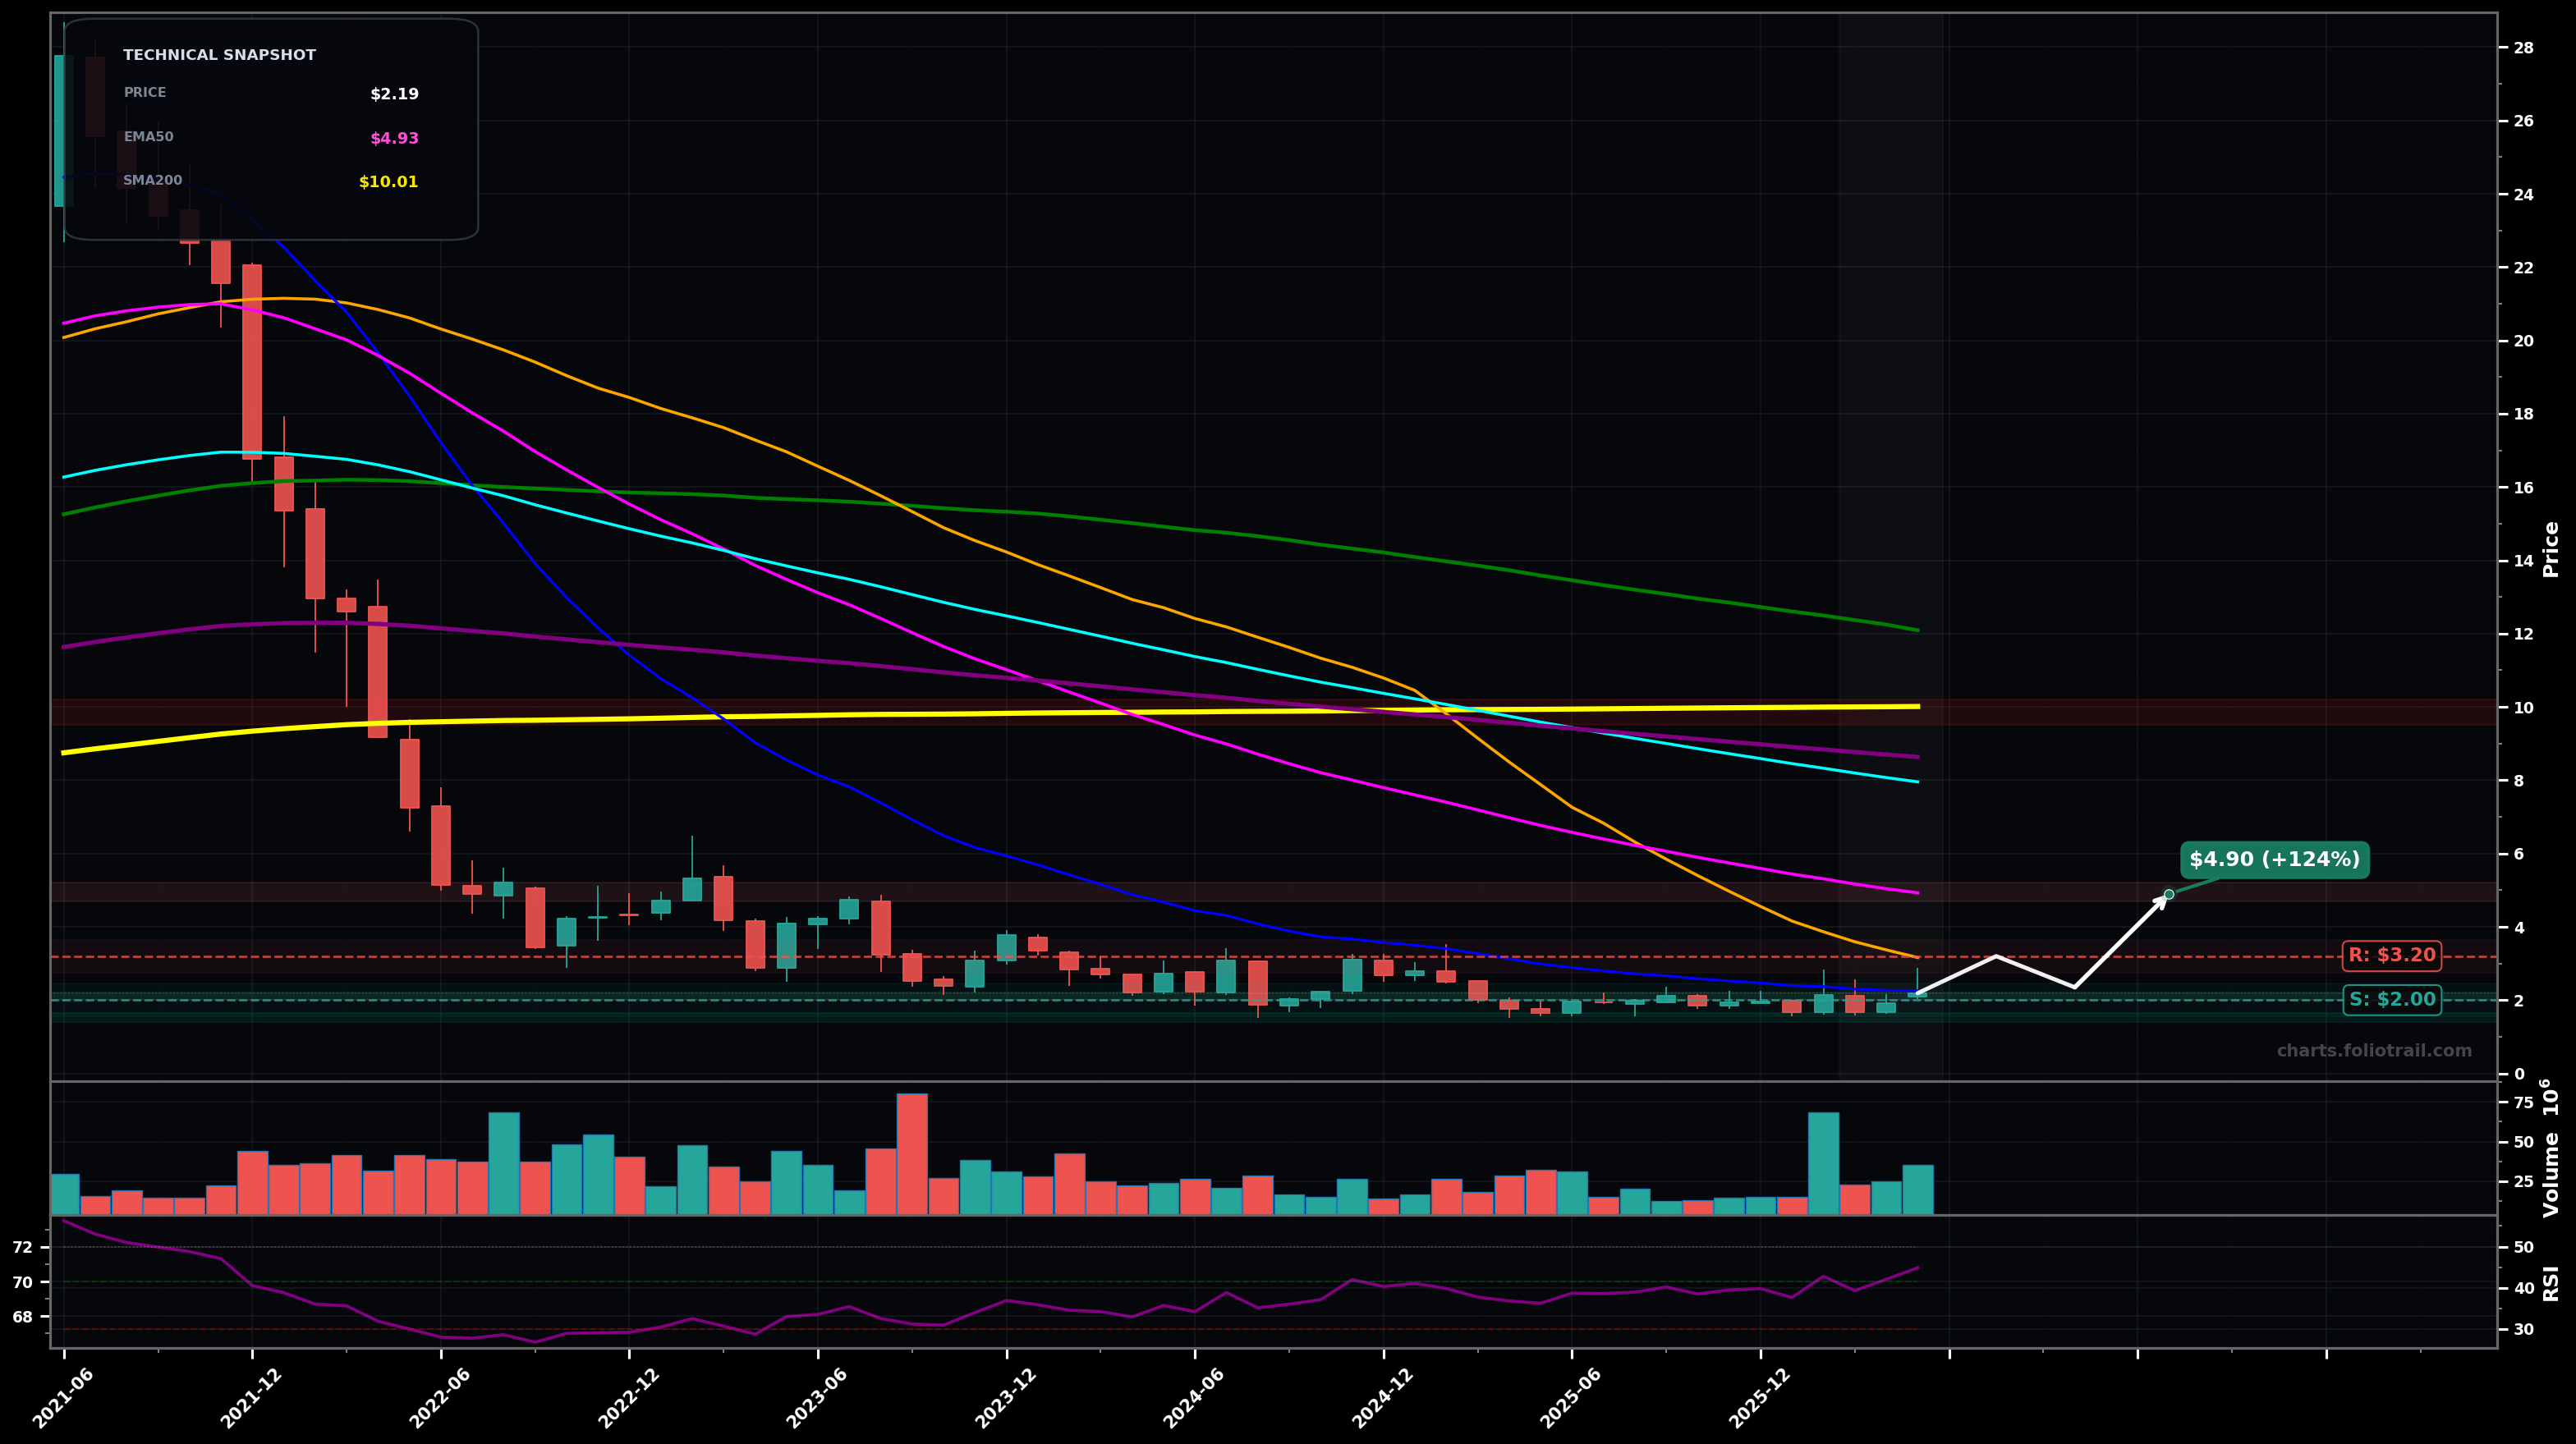
As of May 22, 2026, EGHT (8x8 Inc.) is in a bottoming attempt state on the monthly chart, with a confidence level of 58%. Key support is at $2.00 and key resistance at $3.20. Monthly price around $2.19 after a long decline; tight candles near lows with a small recent bounce while still below all key MAs; RSI ~45 recovering but not strong.
Base-building continues: price holds ~$2.00 support, grinds up to test the falling SMA50 (~$3.16) and prior pivot supply; rejection is possible but higher odds of a slow reclaim attempt than an immediate breakdown.
Bear continuation: failure to reclaim ~$2.35-$2.50 and a loss of the base support triggers another leg down (capitulation risk if volume expands on red months).
Monthly close > $3.20 and then hold with a second close above $3.20 (reclaim the ~$3.16 SMA50/orange area).
Monthly close < $1.90 (breakdown/renewed LL from the base).
Accumulation only makes sense against the base: start near the multi-month floor ~$2; add on a controlled undercut; heavy add only if capitulation tags deeper support while structure still repairs.
Trim into overhead MA clusters: first near prior swing/EMA50 area extension (~$5), more at EMA100/EMA200 zone (~$8), and close into the major SMA200/EMA200 overhead supply band (~$10) where long-term bagholder resistance is likely.
As of May 22, 2026, EGHT (8x8 Inc.) is in a bottoming attempt state on the monthly chart with 58% confidence. Monthly price around $2.19 after a long decline; tight candles near lows with a small recent bounce while still below all key MAs; RSI ~45 recovering but not strong.
On the monthly timeframe, EGHT has key support at $2.00 and key resistance at $3.20. The most likely scenario (bullish) targets $3.20 and $4.90, with a revert level at $2.35.
EGHT (8x8 Inc.) is currently classified as bottoming attempt on the monthly chart, with 58% confidence. Confirmation requires: Monthly close > $3.20 and then hold with a second close above $3.20 (reclaim the ~$3.16 SMA50/orange area). This would be invalidated by: Monthly close < $1.90 (breakdown/renewed LL from the base).
The most likely scenario (bullish) targets $3.20 and $4.90, with a revert level at $2.35. The alternative scenario (bearish) targets $1.90 and $1.40.
Multi-layer AI agents analyse 200+ stocks across daily, weekly, and monthly timeframes — producing market state classifications, price scenarios with targets, and position entry/exit levels. Daily charts updated every trading day at 6 PM ET. Weekly charts refresh Fridays. Monthly charts refresh on the last trading day of each month. No paywall. No sign-up required.
Built by Foliotrail.
All content on this website — including charts, analysis, price targets, support/resistance levels, and position zones — is generated entirely by AI and provided for educational and informational purposes only.
This is not financial advice. NEXUSNOIR VENTURES SL (the operator of this website) is not a registered investment adviser or broker-dealer. You should not make investment decisions based solely on this information. Always do your own research and consult a qualified financial advisor.
By continuing, you acknowledge that you have read and agree to our full disclaimer & terms of use and privacy policy.