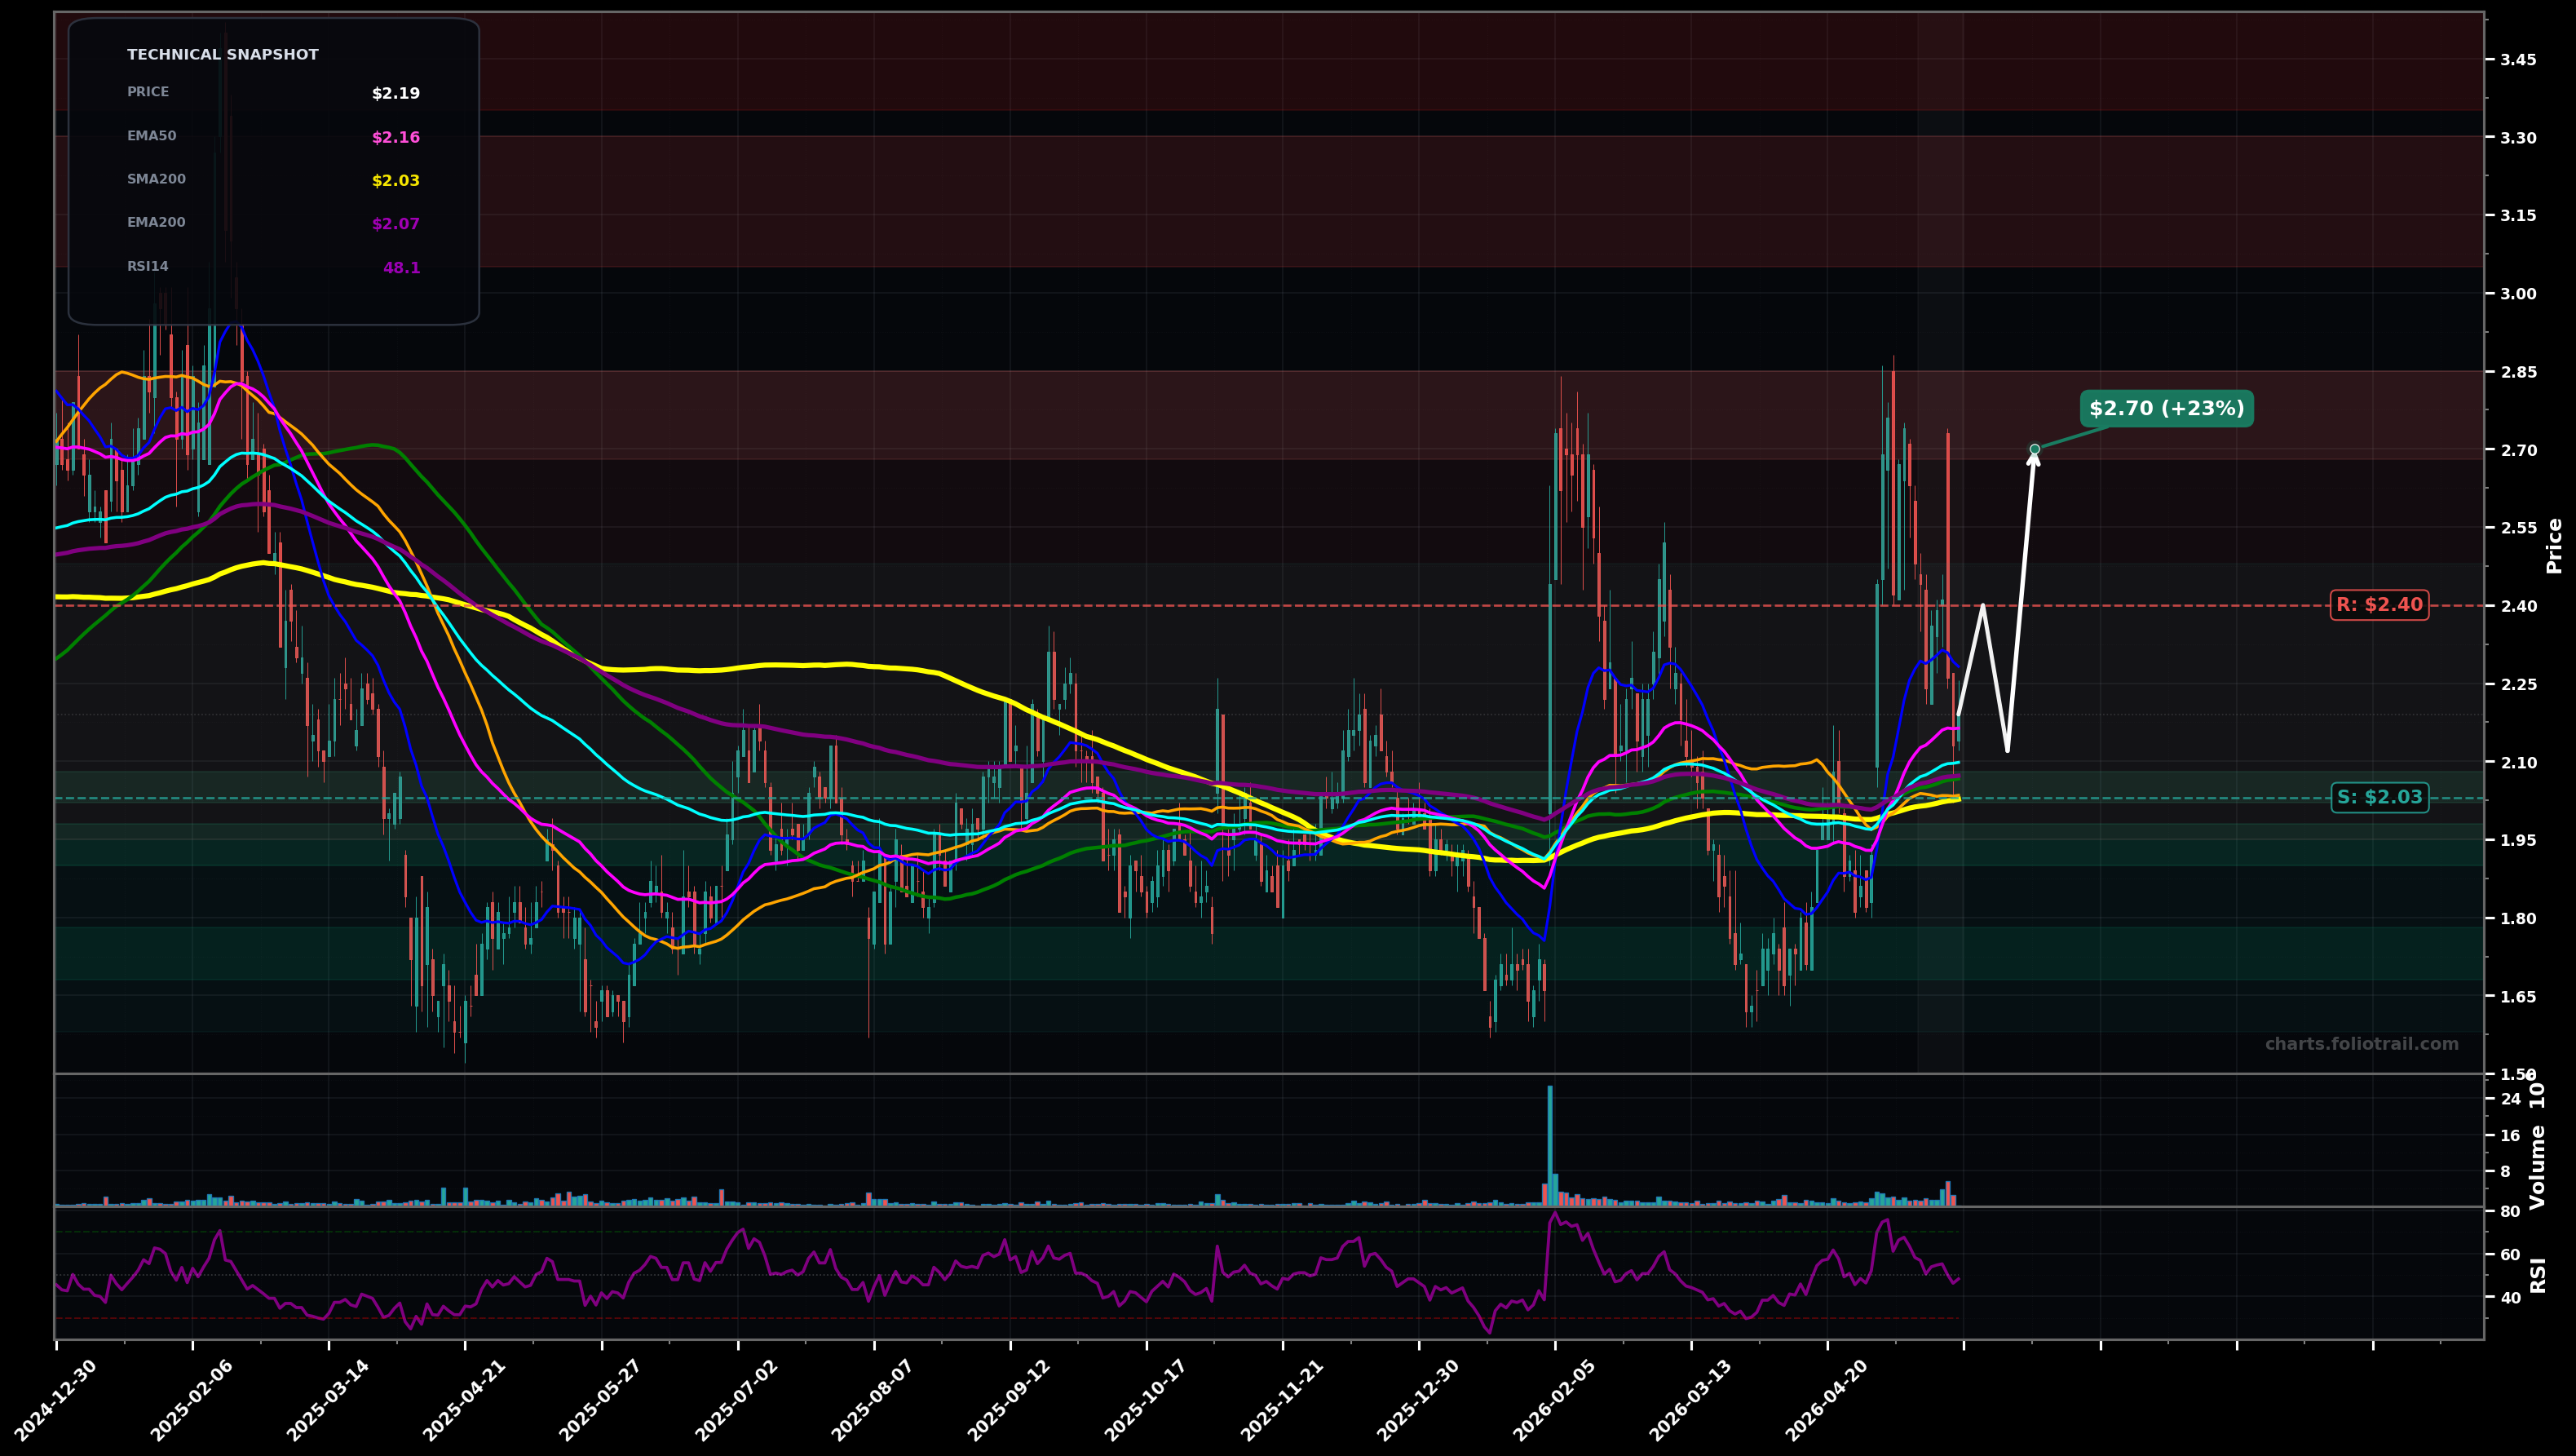
As of May 22, 2026, EGHT (8x8 Inc.) is in a choppy range state on the daily chart, with a confidence level of 62%. Key support is at $2.03 and key resistance at $2.40. Price at $2.19 is hovering just above the clustered long MAs (SMA50/100/200 and EMA100/200) after a sharp spike to ~$2.80 and pullback; RSI ~48 shows momentum cooled back to neutral.
Range continuation: chop between the MA cluster (~$2.03–$2.10) and the prior breakdown area near ~$2.40, with a mild mean-reversion bias as long as $2.00 holds.
Range breakdown: loss of the MA cluster and the $2.00 handle triggers a move back toward the prior swing-base zone from the March/April lows.
Confirm CHOPPY_RANGE if price continues to hold between $2.00 and $2.40 with multiple closes crossing EMA50 ($2.16).
Invalidate if daily closes hold above $2.40 for 2+ sessions (breakout/reversal) or close below $2.00 (range breakdown).
Start near confluence support (SMA/EMA cluster + prior pivots ~$2.03–$2.10); add on confirmed range breakdown toward next demand; heavy add only near prior swing-low base (~$1.70s).
Trim into overhead supply from the recent spike highs (~$2.7–$2.8) and measured-extension zones; heavier trims/close if price becomes stretched well above the full MA stack and revisits prior multi-month resistance ($3.0+).
As of May 22, 2026, EGHT (8x8 Inc.) is in a choppy range state on the daily chart with 62% confidence. Price at $2.19 is hovering just above the clustered long MAs (SMA50/100/200 and EMA100/200) after a sharp spike to ~$2.80 and pullback; RSI ~48 shows momentum cooled back to neutral.
On the daily timeframe, EGHT has key support at $2.03 and key resistance at $2.40. The most likely scenario (bullish) targets $2.40 and $2.70, with a revert level at $2.12.
EGHT (8x8 Inc.) is currently classified as choppy range on the daily chart, with 62% confidence. Confirmation requires: Confirm CHOPPY_RANGE if price continues to hold between $2.00 and $2.40 with multiple closes crossing EMA50 ($2.16). This would be invalidated by: Invalidate if daily closes hold above $2.40 for 2+ sessions (breakout/reversal) or close below $2.00 (range breakdown).
The most likely scenario (bullish) targets $2.40 and $2.70, with a revert level at $2.12. The alternative scenario (bearish) targets $1.95 and $1.70.
Multi-layer AI agents analyse 200+ stocks across daily, weekly, and monthly timeframes — producing market state classifications, price scenarios with targets, and position entry/exit levels. Daily charts updated every trading day at 6 PM ET. Weekly charts refresh Fridays. Monthly charts refresh on the last trading day of each month. No paywall. No sign-up required.
Built by Foliotrail.
All content on this website — including charts, analysis, price targets, support/resistance levels, and position zones — is generated entirely by AI and provided for educational and informational purposes only.
This is not financial advice. NEXUSNOIR VENTURES SL (the operator of this website) is not a registered investment adviser or broker-dealer. You should not make investment decisions based solely on this information. Always do your own research and consult a qualified financial advisor.
By continuing, you acknowledge that you have read and agree to our full disclaimer & terms of use and privacy policy.