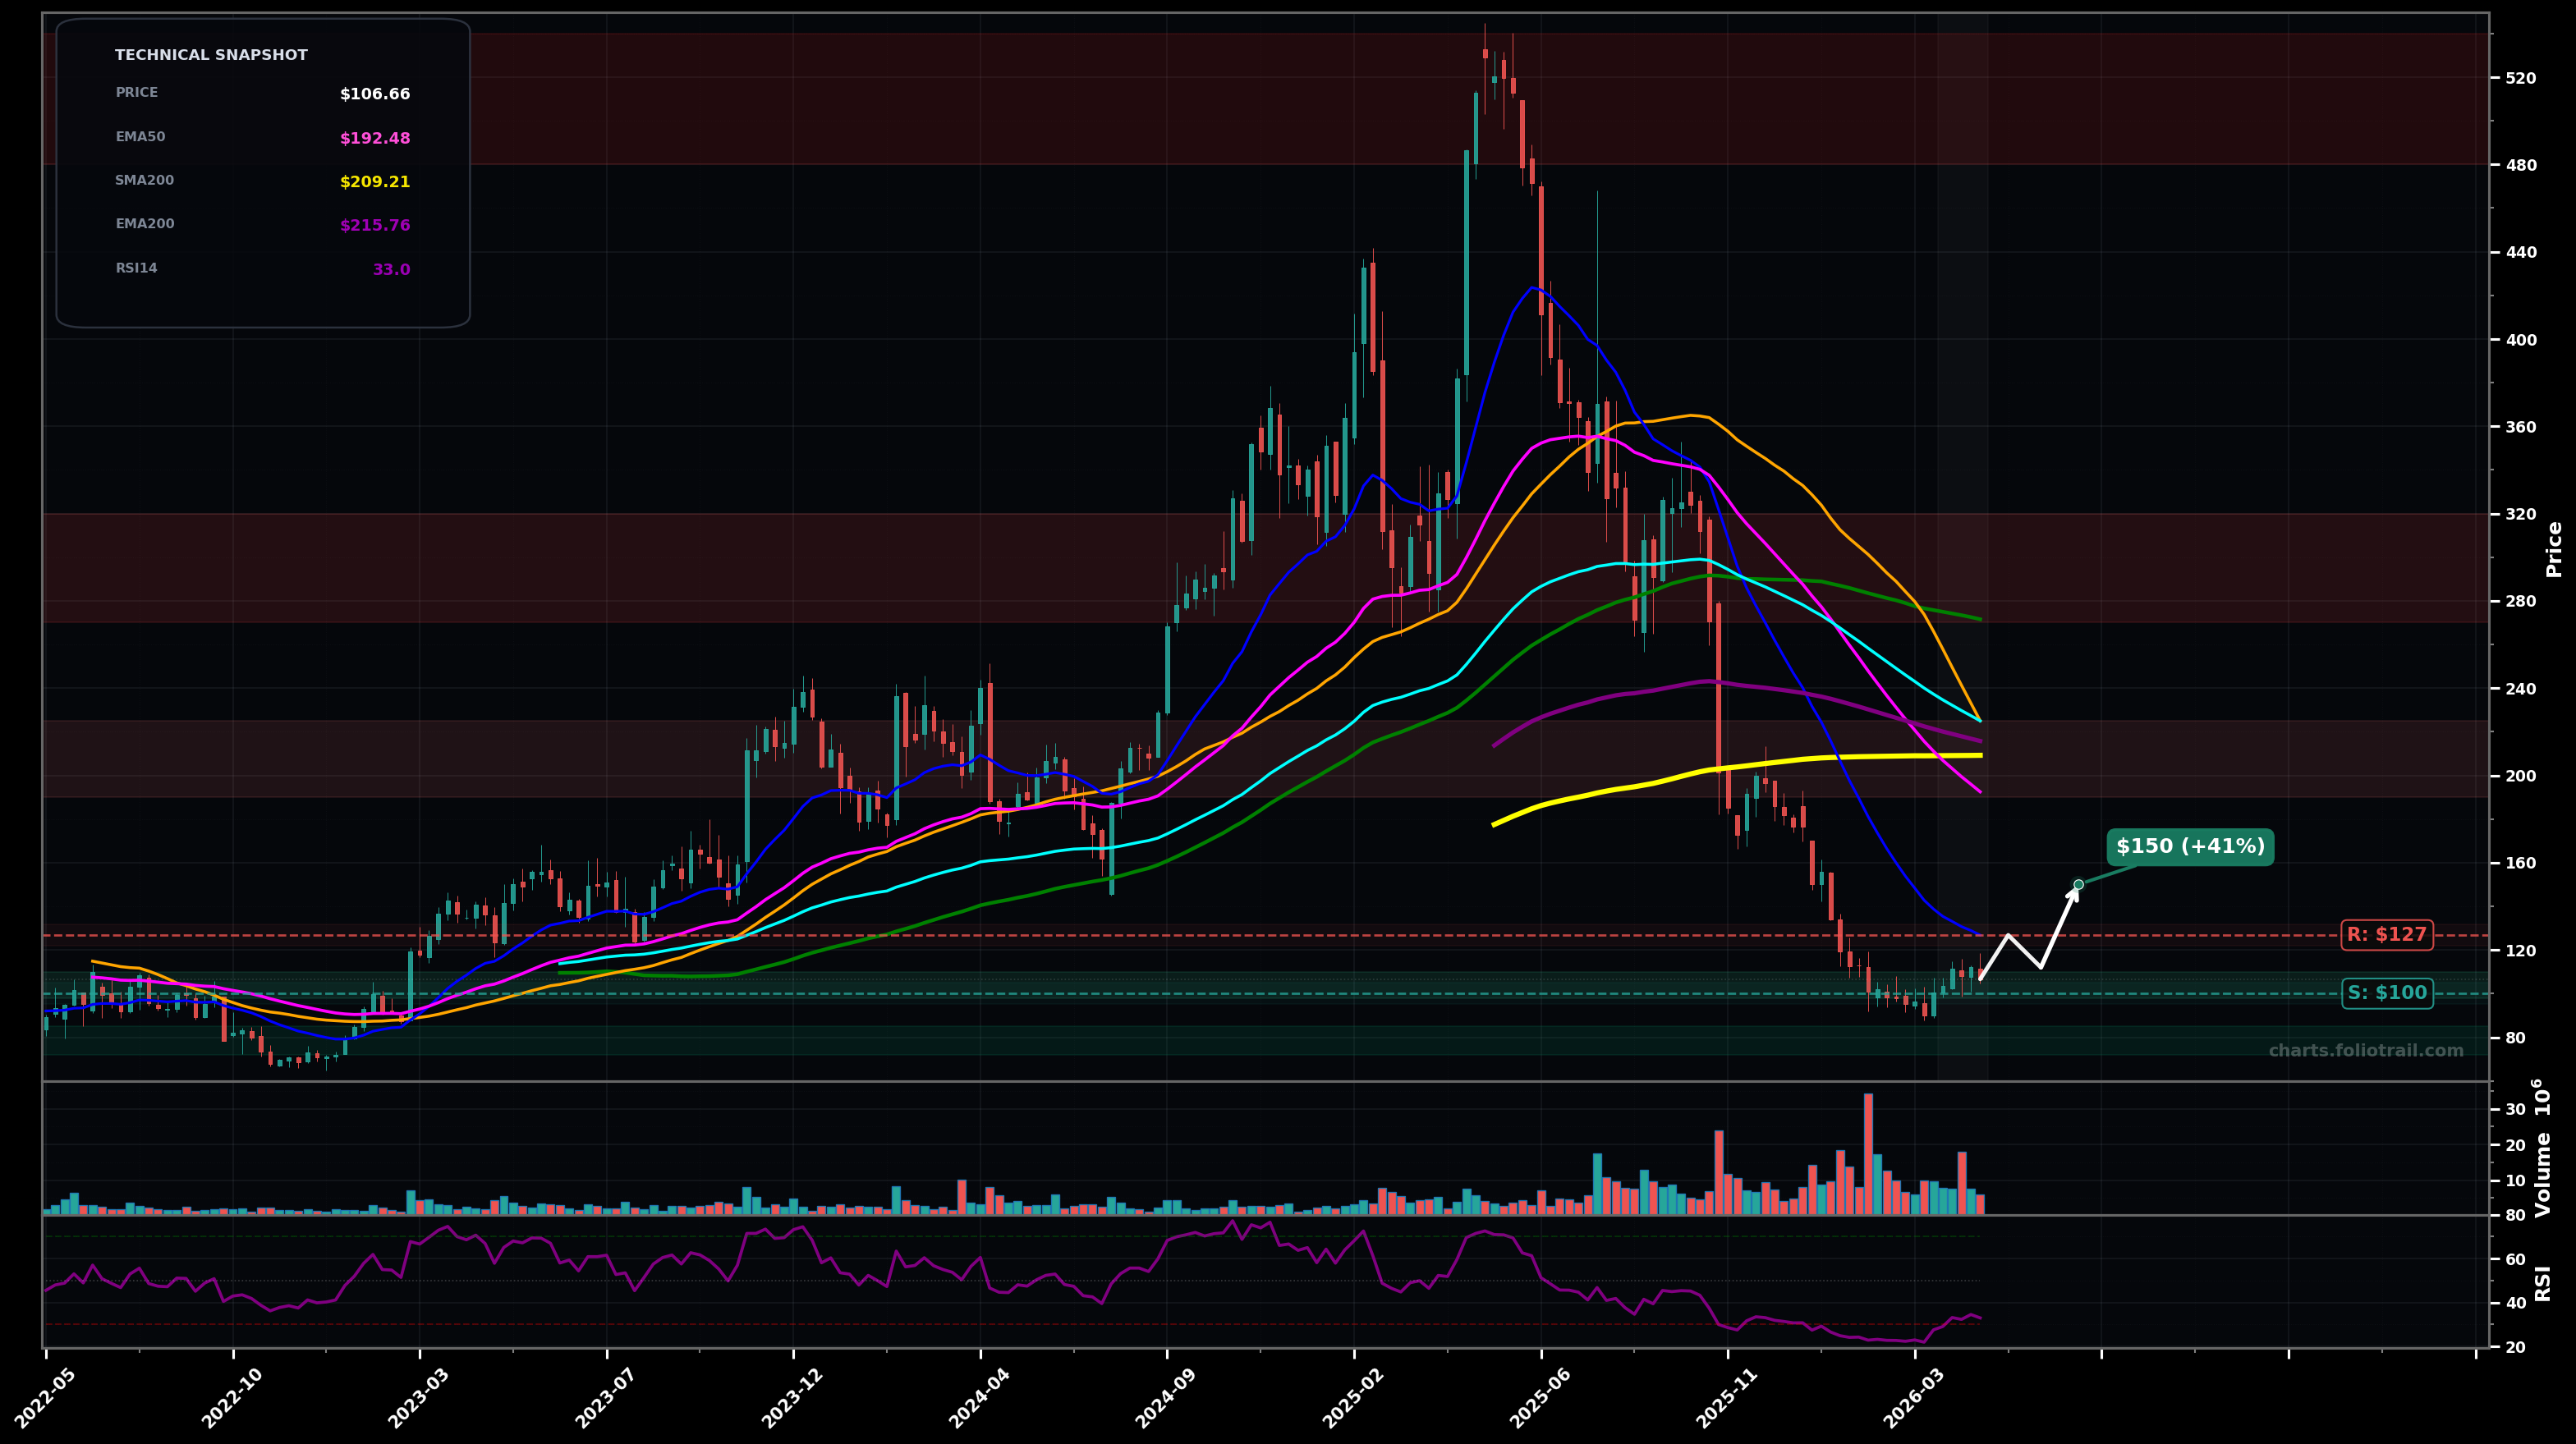
As of May 22, 2026, DUOL (Duolingo, Inc.) is in a falling knife state on the weekly chart, with a confidence level of 72%. Key support is at $100 and key resistance at $127. Weekly downtrend from the $520+ peak; price now $106.66 is below all key MAs and trying a small rebound after a recent swing low; RSI(14) ~33 (weak/oversold-leaning).
Base-building attempt: hold ~$100, grind higher toward the first major dynamic resistance (EMA20) and potentially a mean-reversion bounce into the prior breakdown zone.
Trend continuation: lose the ~$100 pivot, triggering another capitulation leg before any sustainable reversal; only then a reflex bounce.
Weekly close back below $100 followed by continuation to a new low would confirm FALLING_KNIFE continuation
Two weekly closes above $126.81 (EMA20) would invalidate the immediate knife-like momentum and shift toward a bottoming attempt
Start near the $100 pivot (recent swing-low area); add on breakdown/retest of $100; heavy add only near deeper capitulation support where reward/risk improves while still below falling EMA20/50.
Trim into mean-reversion resistance clusters (EMA50/EMA100/EMA200 + prior breakdown supply); larger trims near prior multi-month distribution zone; fully close into retest of the prior blow-off top region.
As of May 22, 2026, DUOL (Duolingo, Inc.) is in a falling knife state on the weekly chart with 72% confidence. Weekly downtrend from the $520+ peak; price now $106.66 is below all key MAs and trying a small rebound after a recent swing low; RSI(14) ~33 (weak/oversold-leaning).
On the weekly timeframe, DUOL has key support at $100 and key resistance at $127. The most likely scenario (bullish) targets $127 and $150, with a revert level at $112.
DUOL (Duolingo, Inc.) is currently classified as falling knife on the weekly chart, with 72% confidence. Confirmation requires: Weekly close back below $100 followed by continuation to a new low would confirm FALLING_KNIFE continuation This would be invalidated by: Two weekly closes above $126.81 (EMA20) would invalidate the immediate knife-like momentum and shift toward a bottoming attempt
The most likely scenario (bullish) targets $127 and $150, with a revert level at $112. The alternative scenario (bearish) targets $90.0 and $75.0.
Multi-layer AI agents analyse 200+ stocks across daily, weekly, and monthly timeframes — producing market state classifications, price scenarios with targets, and position entry/exit levels. Daily charts updated every trading day at 6 PM ET. Weekly charts refresh Fridays. Monthly charts refresh on the last trading day of each month. No paywall. No sign-up required.
Built by Foliotrail.
All content on this website — including charts, analysis, price targets, support/resistance levels, and position zones — is generated entirely by AI and provided for educational and informational purposes only.
This is not financial advice. NEXUSNOIR VENTURES SL (the operator of this website) is not a registered investment adviser or broker-dealer. You should not make investment decisions based solely on this information. Always do your own research and consult a qualified financial advisor.
By continuing, you acknowledge that you have read and agree to our full disclaimer & terms of use and privacy policy.