As of May 22, 2026, DRAM (Roundhill Memory ETF) is in a volatility expansion state on the monthly chart, with a confidence level of 66%. Key support is at $39.0 and key resistance at $55.0. Monthly continuation higher with a strong bullish candle into ~$52.75 on elevated volume; prior month also green, suggesting momentum expansion.
Bullish continuation: price consolidates briefly above the breakout body then pushes to test/clear the recent high; if accepted above, extension targets come into play (impulse continuation, likely Elliott Wave 3 behavior if this is a new cycle). Prob ~65%.
Bearish mean-reversion: a failed breakout leads to a deeper pullback into the prior month's range (typical Wave 2 / ABC retrace) before a new attempt higher; risk increases if the next month prints a large red close near lows. Prob ~35%.
Monthly close above $55.00 (break/hold above the current swing high zone).
Monthly close below $39.00 (break back into the prior breakout body / failure of the impulse leg).
Buy-the-dip framework: first pullback hold above mid-body (~$47-48), add on deeper retrace into prior range (~$42-45), deploy heavily only on a full retest of the breakout base/support (~$39-40).
Trim into upside extensions where monthly candles become increasingly stretched from the breakout base (probable fib extensions/overextension zones); progressively reduce risk as price moves farther above the key breakout area (~$39-40).
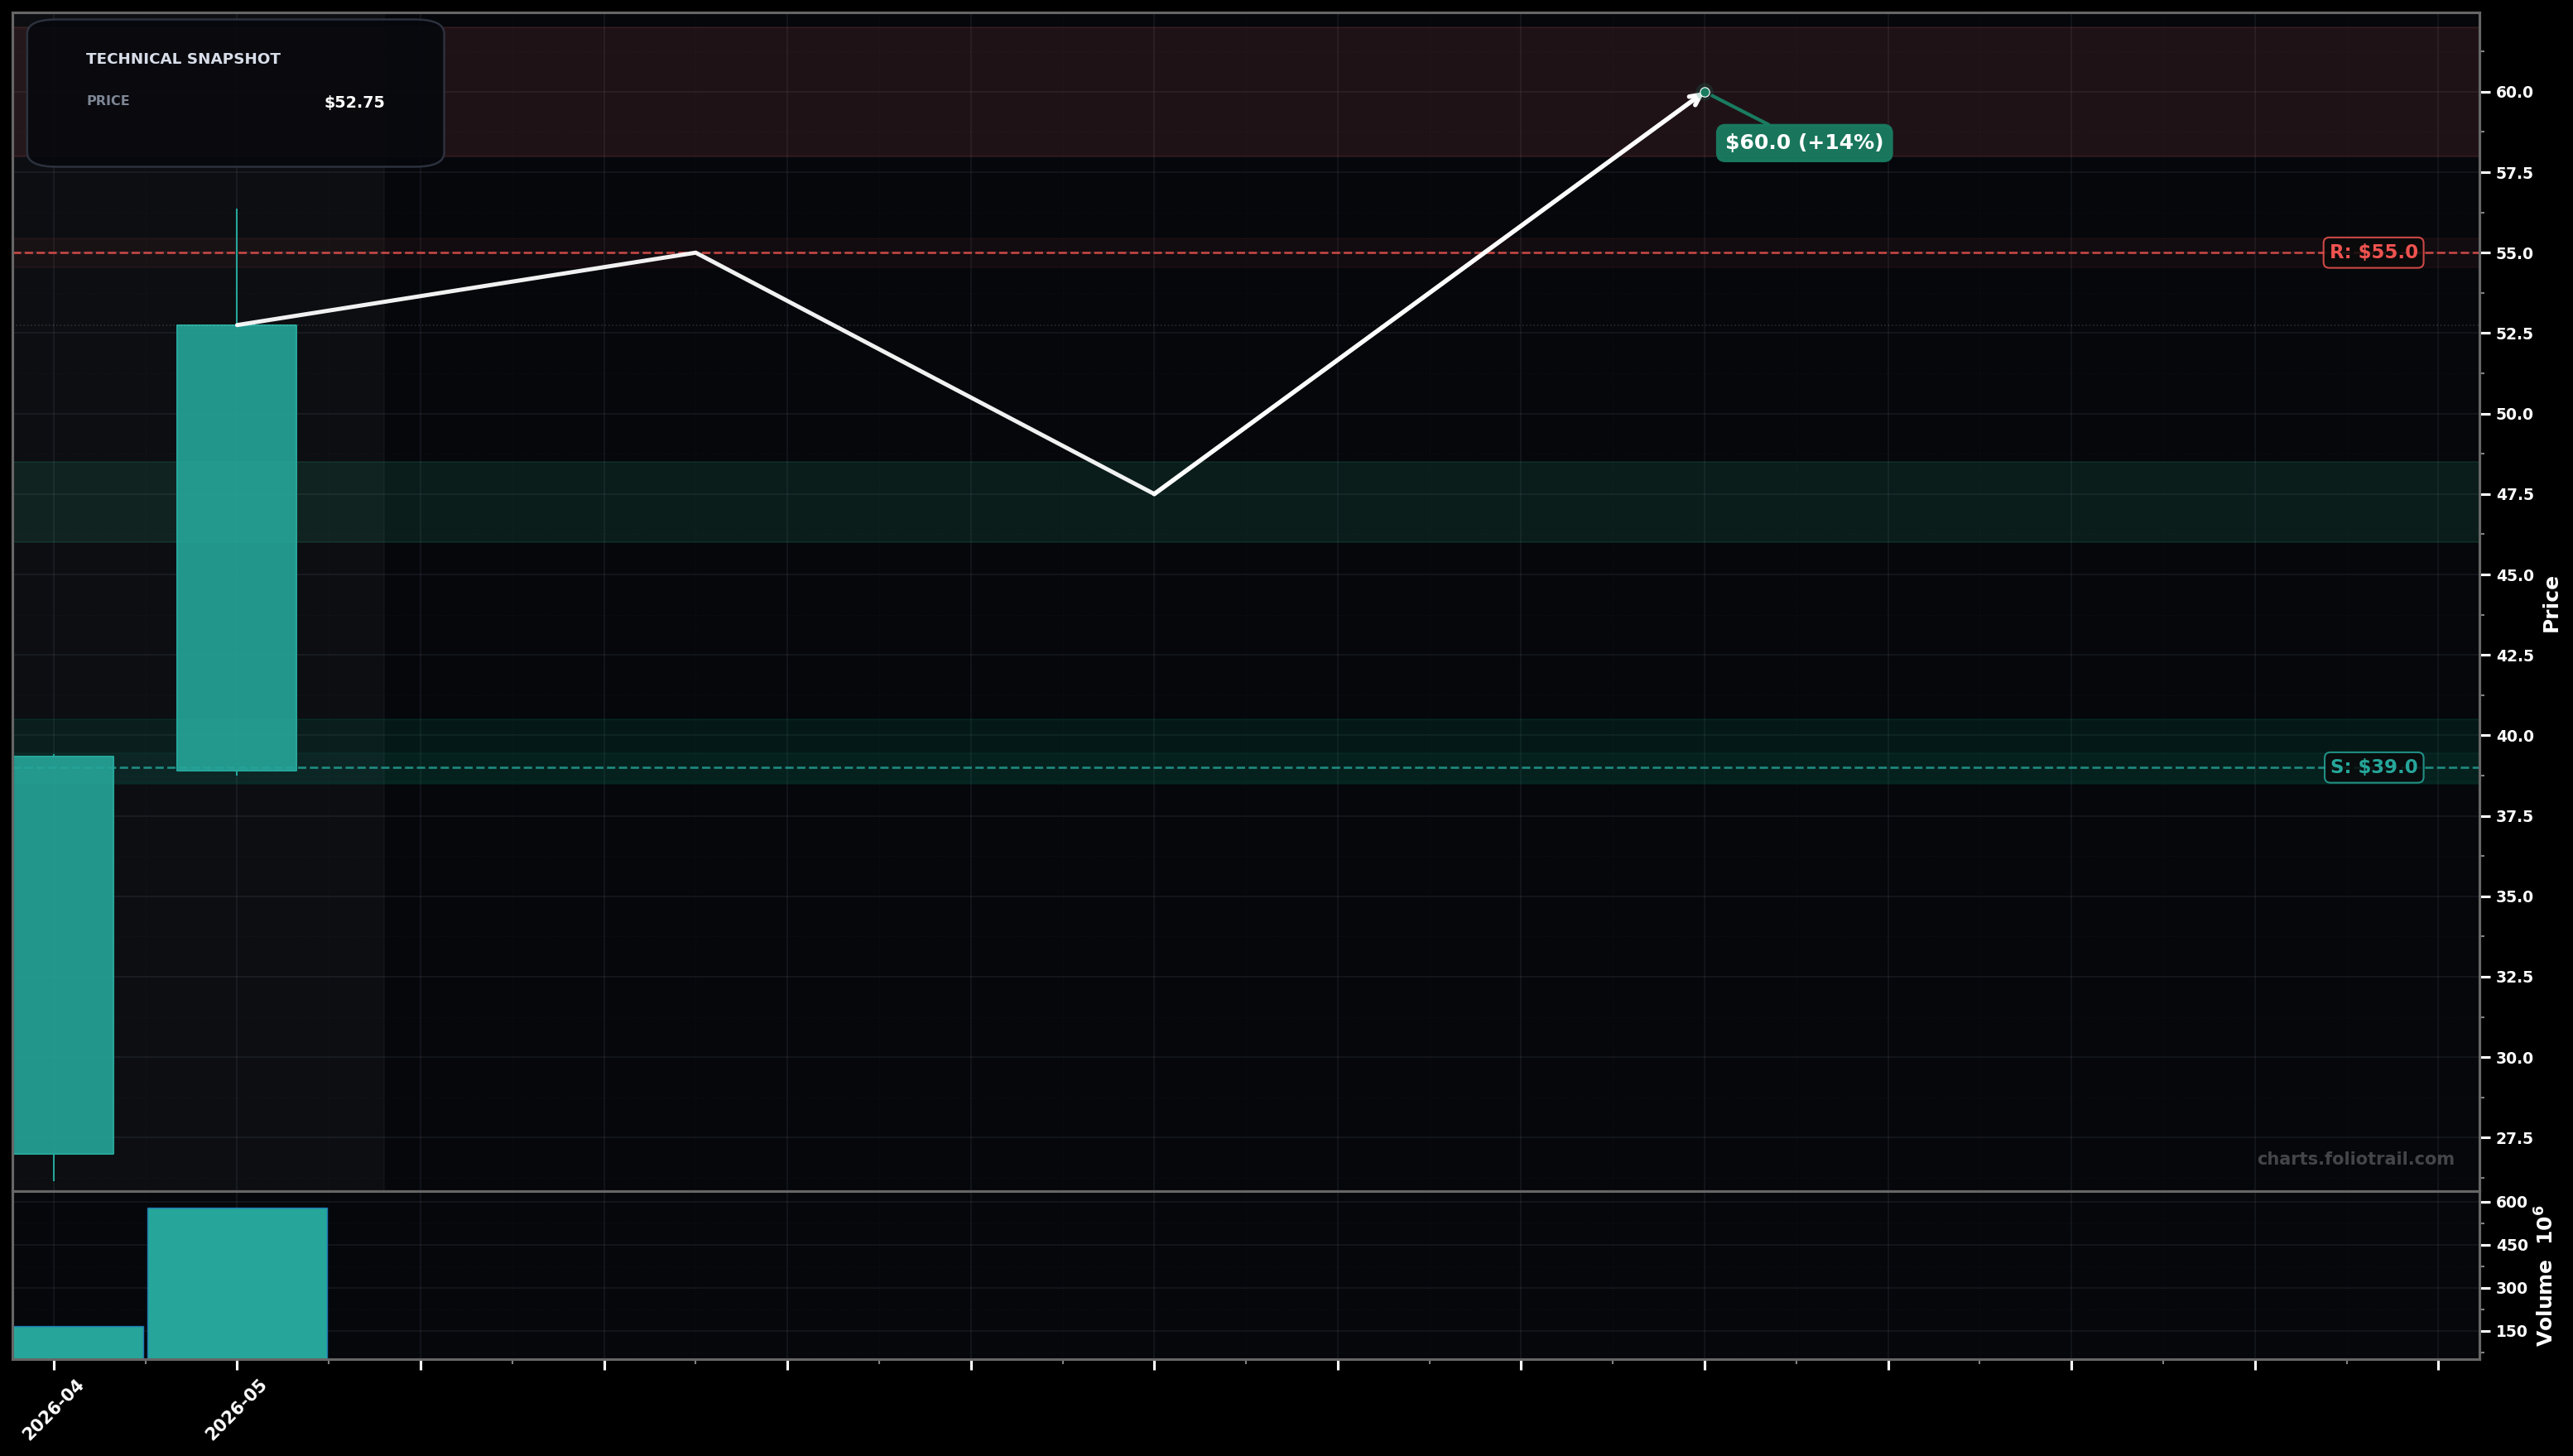
As of May 22, 2026, DRAM (Roundhill Memory ETF) is in a volatility expansion state on the monthly chart with 66% confidence. Monthly continuation higher with a strong bullish candle into ~$52.75 on elevated volume; prior month also green, suggesting momentum expansion.
On the monthly timeframe, DRAM has key support at $39.0 and key resistance at $55.0. The most likely scenario (bullish) targets $55.0 and $60.0, with a revert level at $47.5.
DRAM (Roundhill Memory ETF) is currently classified as volatility expansion on the monthly chart, with 66% confidence. Confirmation requires: Monthly close above $55.00 (break/hold above the current swing high zone). This would be invalidated by: Monthly close below $39.00 (break back into the prior breakout body / failure of the impulse leg).
The most likely scenario (bullish) targets $55.0 and $60.0, with a revert level at $47.5. The alternative scenario (bearish) targets $44.0 and $39.0.
Multi-layer AI agents analyse 200+ stocks across daily, weekly, and monthly timeframes — producing market state classifications, price scenarios with targets, and position entry/exit levels. Daily charts updated every trading day at 6 PM ET. Weekly charts refresh Fridays. Monthly charts refresh on the last trading day of each month. No paywall. No sign-up required.
Built by Foliotrail.
All content on this website — including charts, analysis, price targets, support/resistance levels, and position zones — is generated entirely by AI and provided for educational and informational purposes only.
This is not financial advice. NEXUSNOIR VENTURES SL (the operator of this website) is not a registered investment adviser or broker-dealer. You should not make investment decisions based solely on this information. Always do your own research and consult a qualified financial advisor.
By continuing, you acknowledge that you have read and agree to our full disclaimer & terms of use and privacy policy.