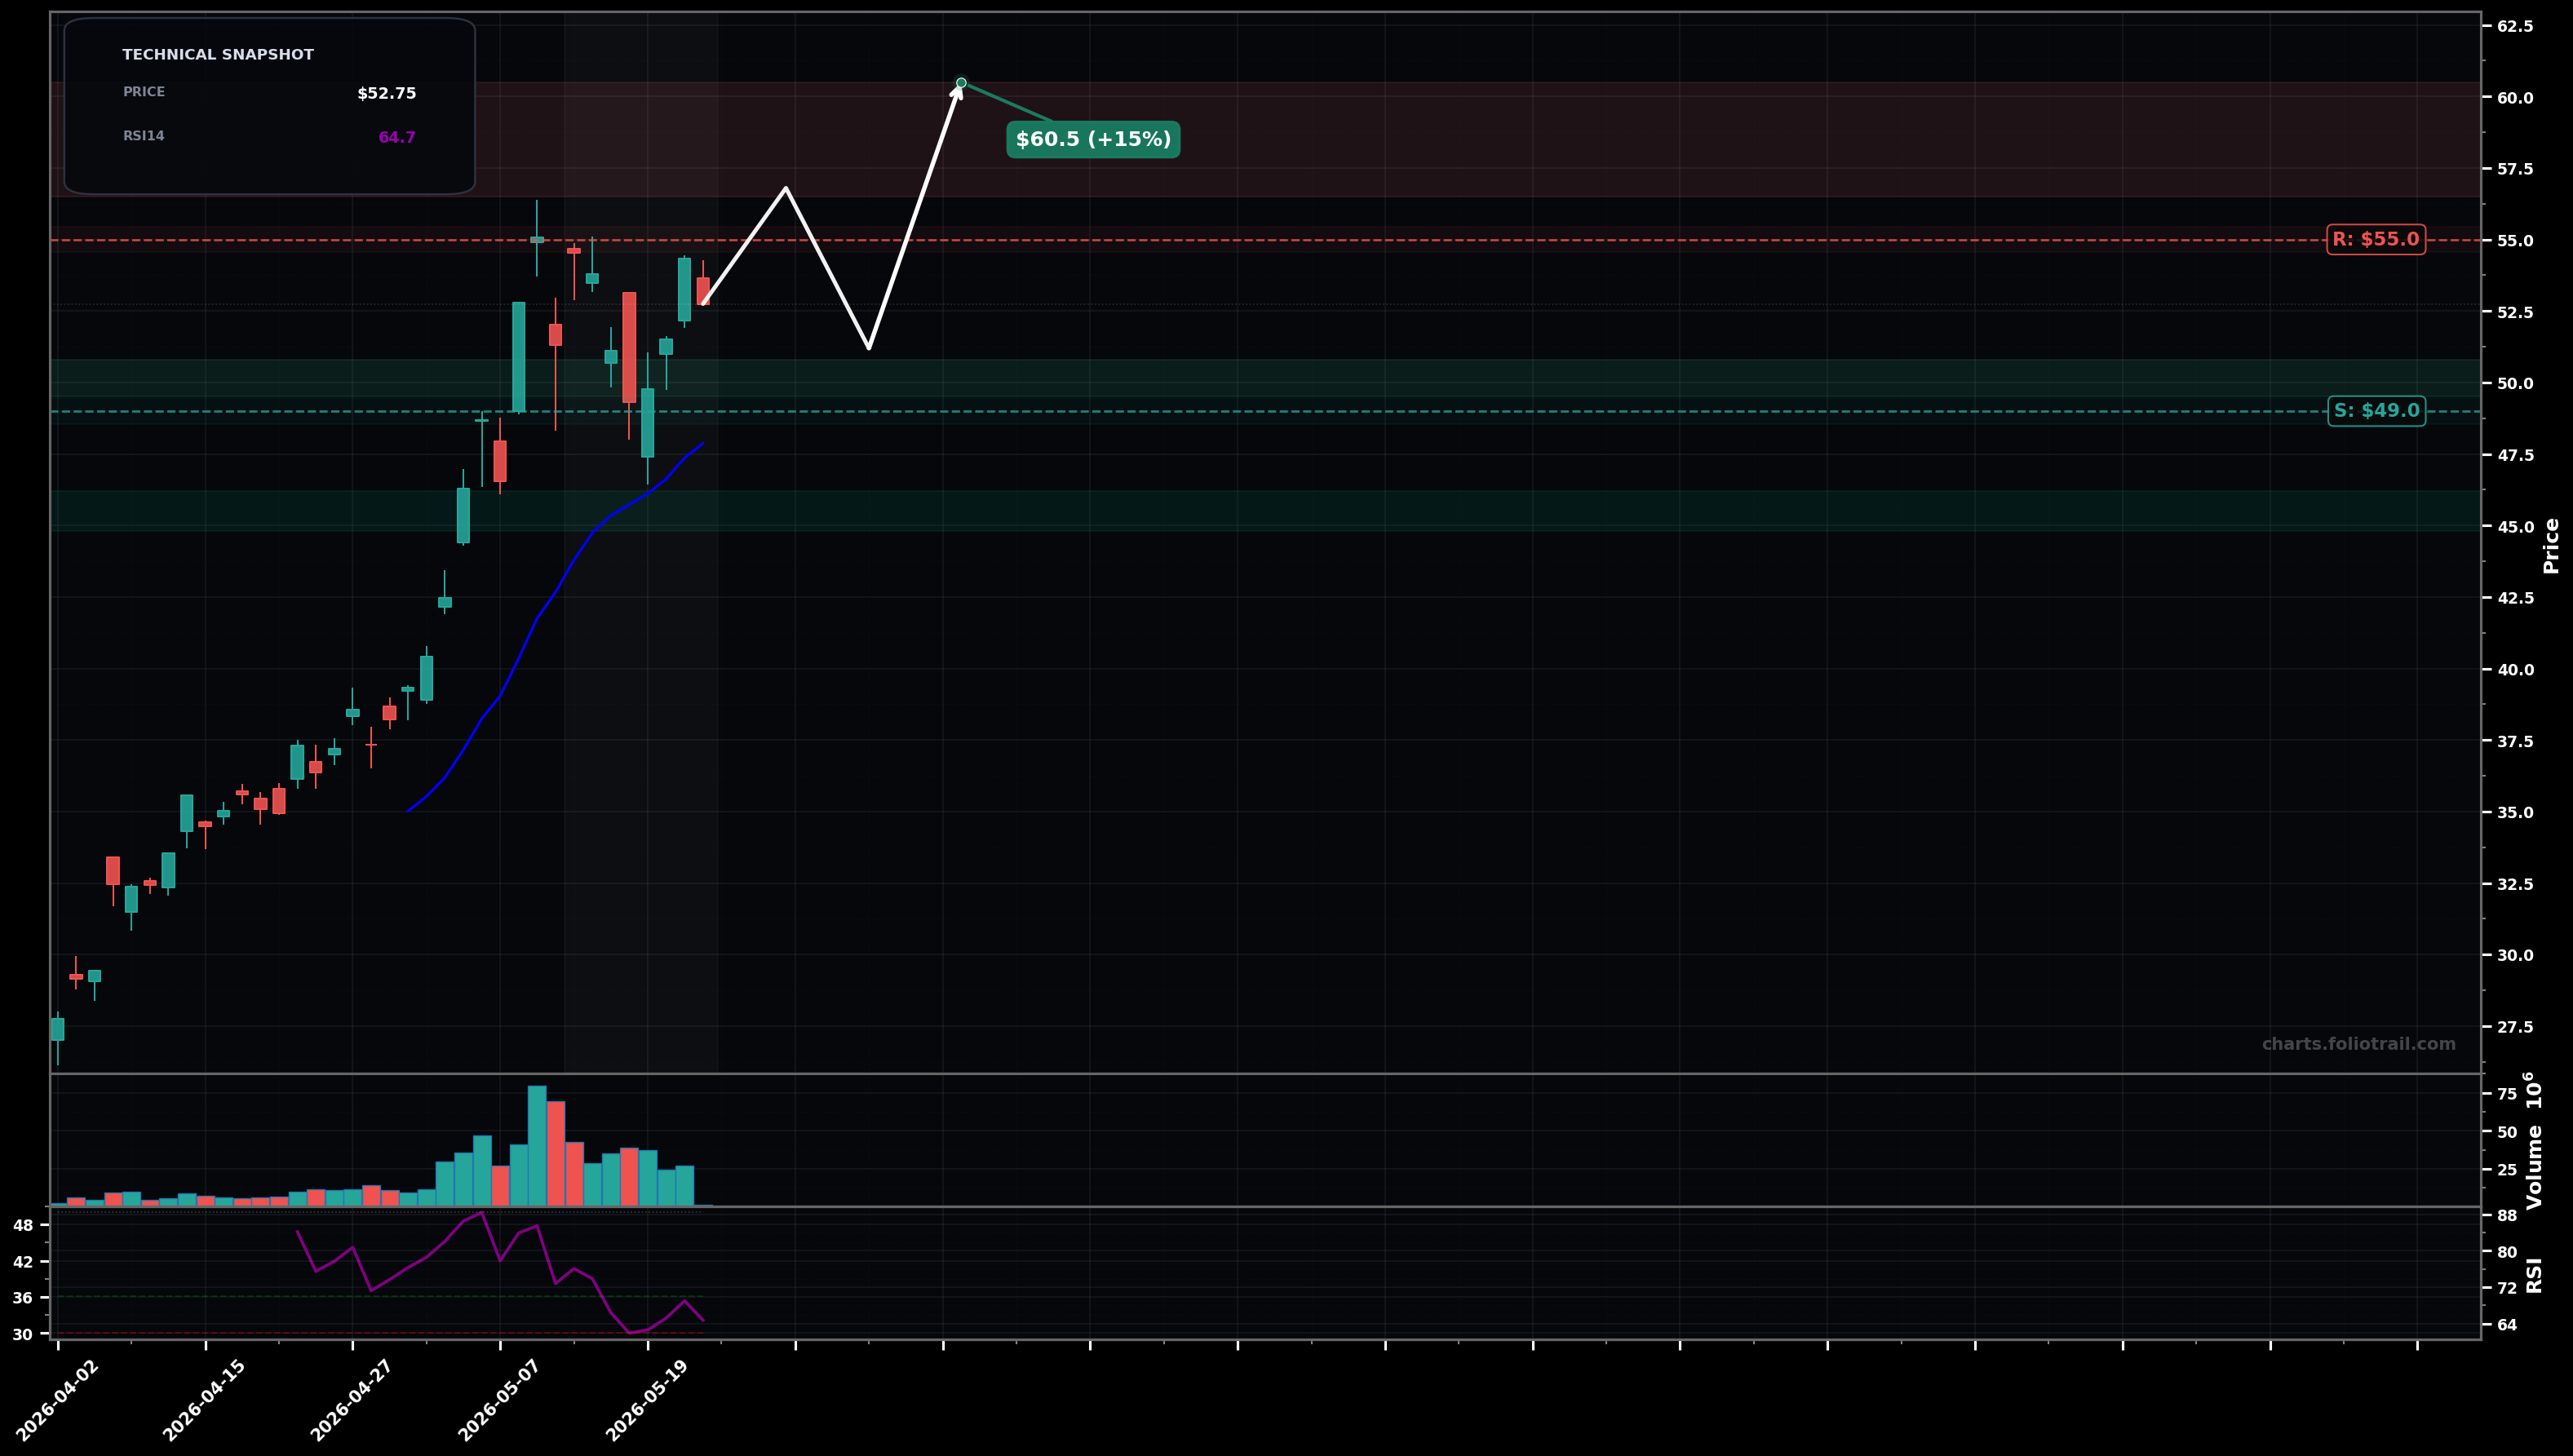
As of May 22, 2026, DRAM (Roundhill Memory ETF) is in a uptrend state on the daily chart, with a confidence level of 72%. Key support is at $49.0 and key resistance at $55.0. Price is consolidating just below the recent swing high (~$55) after a sharp May impulse; still holding above rising EMA20 (~$47.88) with RSI ~64 (bullish but cooling).
Bullish continuation: shallow pullback/sideways above $49-$50 then breakout through $55, targeting a measured push into the high-$50s/low-$60s (Elliott: wave (4) consolidation then wave (5) extension; Fib: 1.272–1.618 extension zone).
Deeper correction: rejection at $55 leads to a larger ABC pullback toward the rising trendline/EMA area (potential wave (4) becomes more complex), with buyers attempting to defend prior breakout levels.
Daily close > $55.20 with follow-through (next close also holding above $55.00).
Daily close < $47.80 (loss of EMA20 + breaks last pullback structure).
Start near prior breakout/round-number support ($50) while trend is intact; add on EMA20/structure retest; heavy-add only if a fuller wave-(4)/ABC retrace tags deeper support (~$45) without capitulation.
Trim into the $55 breakout-to-extension zone (Fib extension / wave-(5) risk); increase trimming if price goes vertical above $60; fully close if an outsized multi-year stretch develops into upper extensions ($66+).
As of May 22, 2026, DRAM (Roundhill Memory ETF) is in a uptrend state on the daily chart with 72% confidence. Price is consolidating just below the recent swing high (~$55) after a sharp May impulse; still holding above rising EMA20 (~$47.88) with RSI ~64 (bullish but cooling).
On the daily timeframe, DRAM has key support at $49.0 and key resistance at $55.0. The most likely scenario (bullish) targets $56.8 and $60.5, with a revert level at $51.2.
DRAM (Roundhill Memory ETF) is currently classified as uptrend on the daily chart, with 72% confidence. Confirmation requires: Daily close > $55.20 with follow-through (next close also holding above $55.00). This would be invalidated by: Daily close < $47.80 (loss of EMA20 + breaks last pullback structure).
The most likely scenario (bullish) targets $56.8 and $60.5, with a revert level at $51.2. The alternative scenario (bearish) targets $47.9 and $45.0.
Multi-layer AI agents analyse 200+ stocks across daily, weekly, and monthly timeframes — producing market state classifications, price scenarios with targets, and position entry/exit levels. Daily charts updated every trading day at 6 PM ET. Weekly charts refresh Fridays. Monthly charts refresh on the last trading day of each month. No paywall. No sign-up required.
Built by Foliotrail.
All content on this website — including charts, analysis, price targets, support/resistance levels, and position zones — is generated entirely by AI and provided for educational and informational purposes only.
This is not financial advice. NEXUSNOIR VENTURES SL (the operator of this website) is not a registered investment adviser or broker-dealer. You should not make investment decisions based solely on this information. Always do your own research and consult a qualified financial advisor.
By continuing, you acknowledge that you have read and agree to our full disclaimer & terms of use and privacy policy.