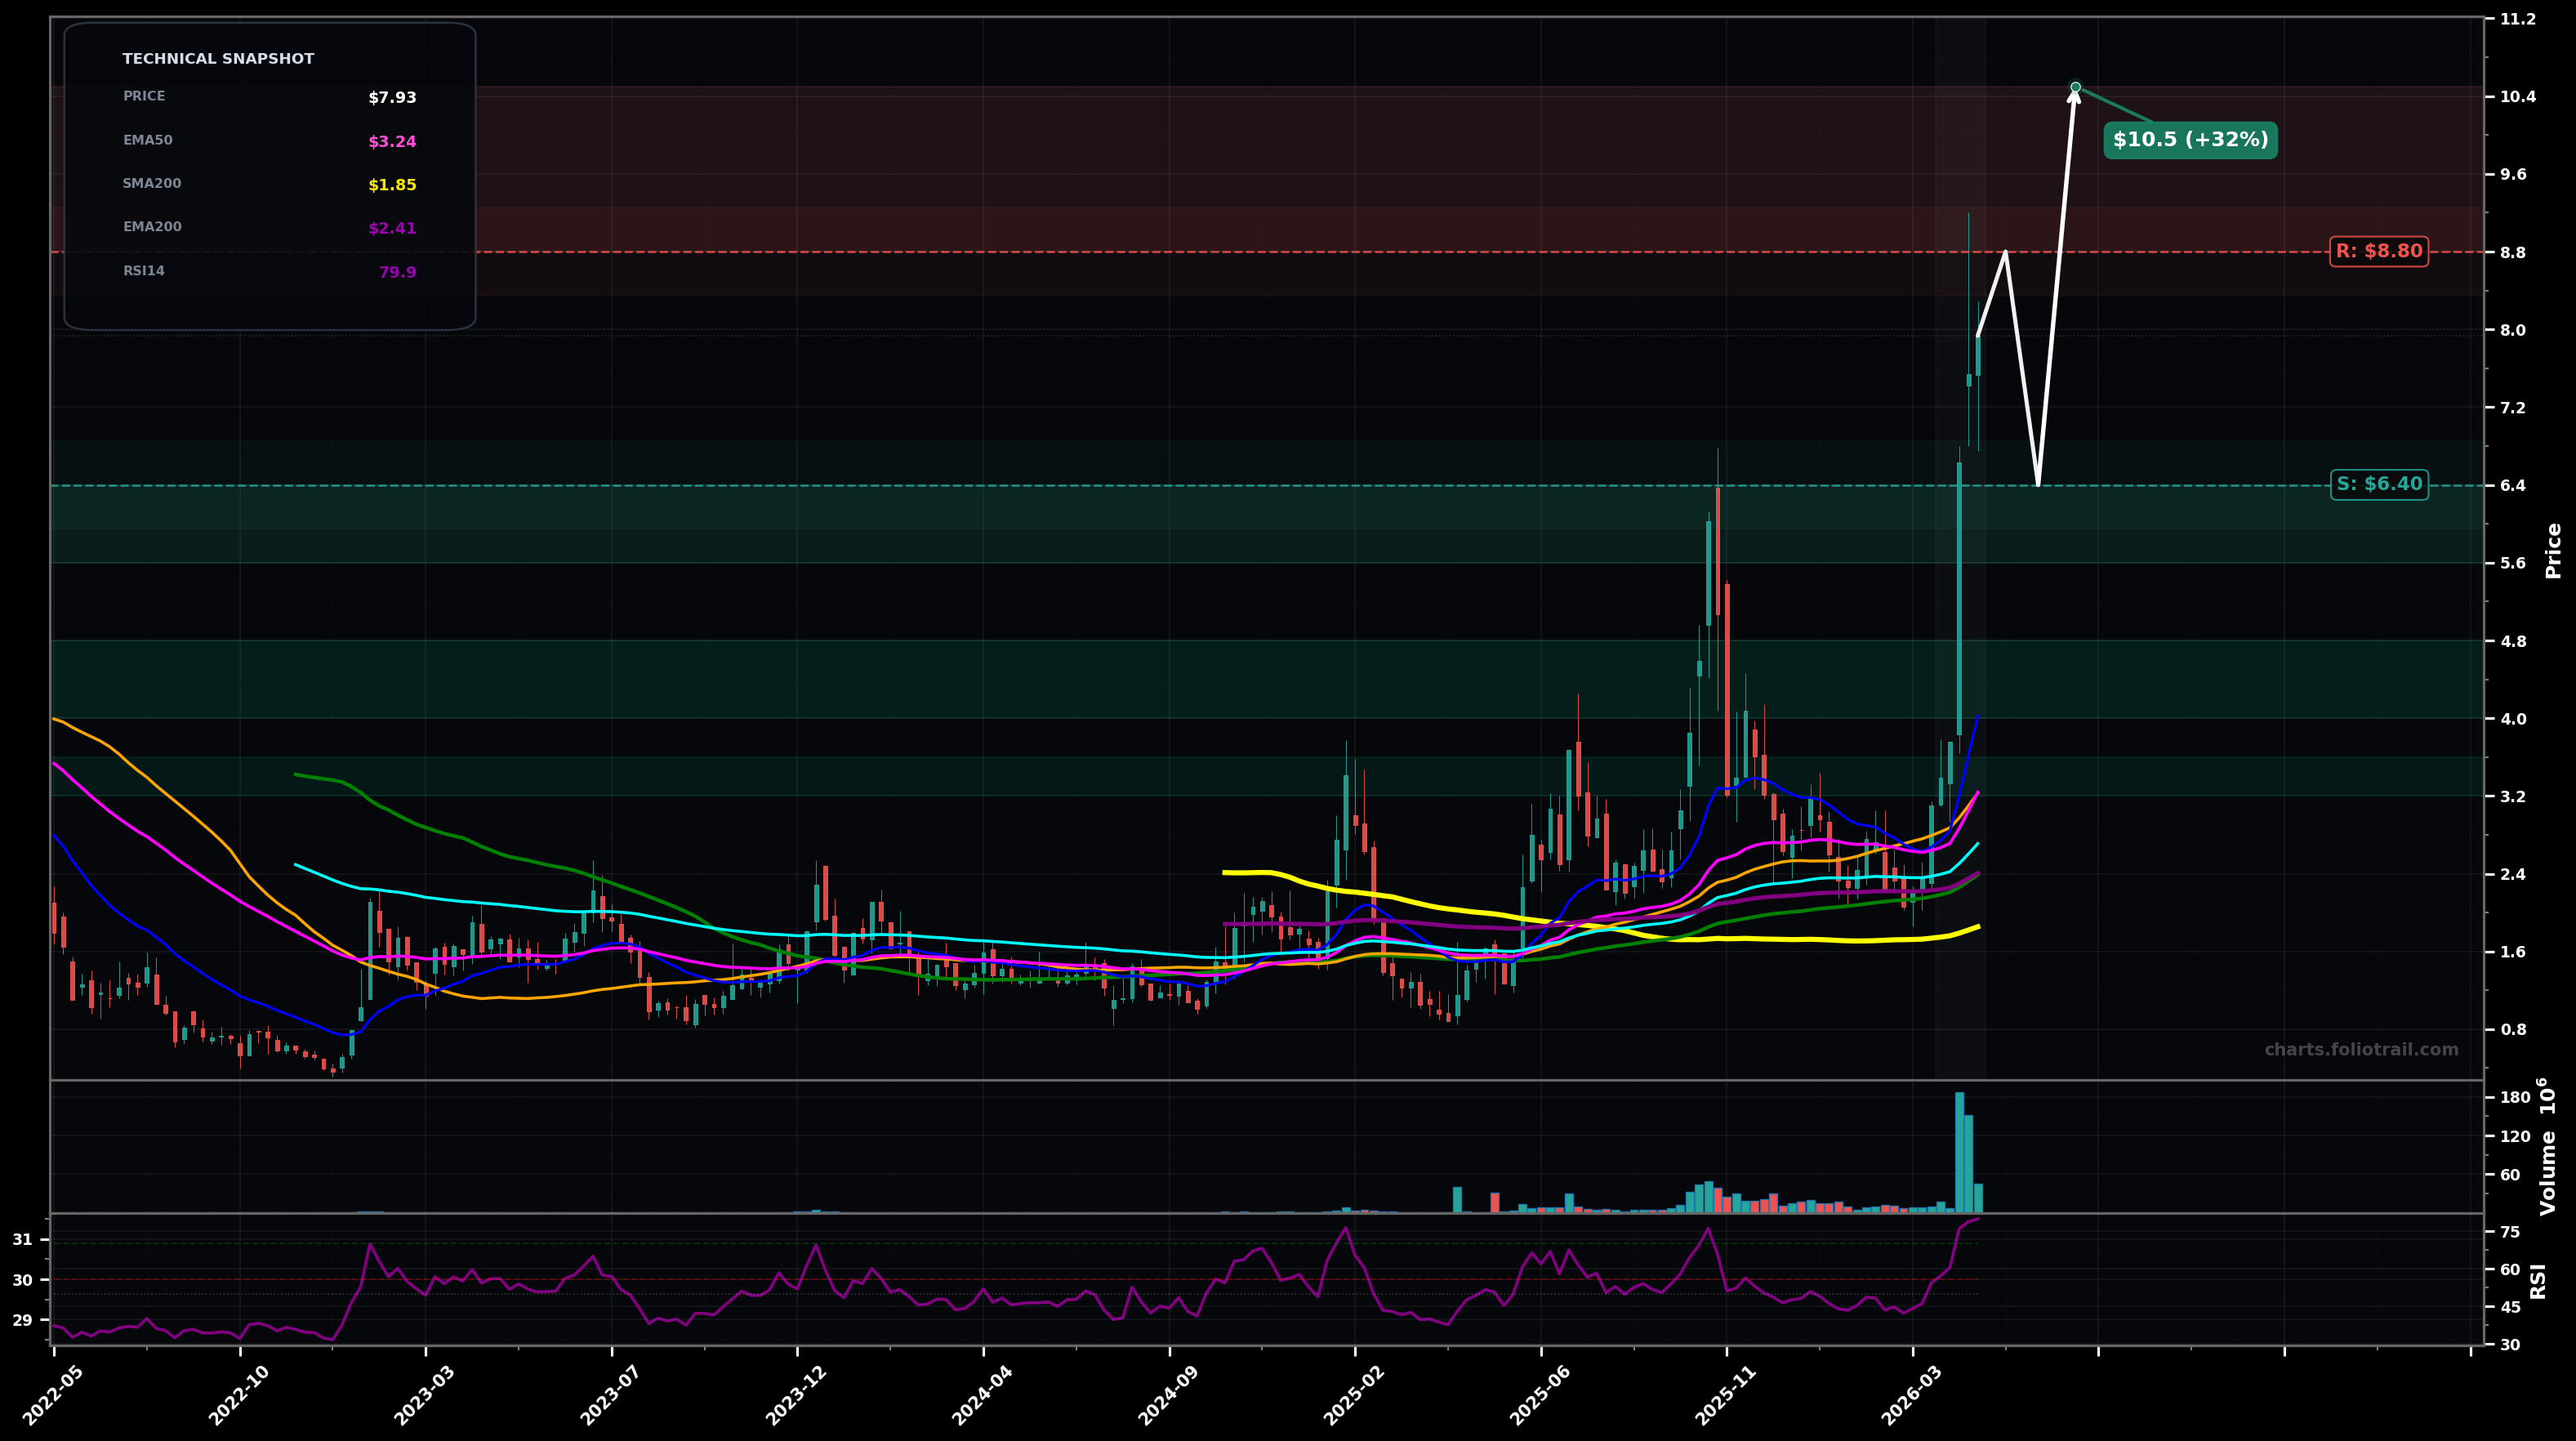
As of May 22, 2026, DGXX (Digi Power X Inc.) is in a parabolic state on the weekly chart, with a confidence level of 76%. Key support is at $6.40 and key resistance at $8.80. Weekly breakout/vertical impulse to ~$7.93 with extreme volume expansion; price far above all key MAs; RSI-14 ~79.9 (overbought).
Continuation with controlled consolidation: price chops/pulls back modestly, holds above prior breakout area, then attempts a new high (Elliott: extended wave 3 or wave 5 push after a brief wave-4 style pause).
Blow-off top then mean reversion: sharp retrace toward fast MAs/previous base as late buyers get trapped (Elliott: wave-5 exhaustion into an ABC pullback).
2+ weekly closes holding above ~$6.40 would confirm a sustained parabola rather than a one-week blow-off.
Weekly close back below ~$4.00 (near EMA20 ~$4.02) would invalidate the parabolic continuation and signal a deeper mean-reversion phase.
Prefer entries on pullbacks to broken resistance/EMA20 (~$4.02) and toward EMA50/SMA50 (~$3.2-$3.3) to avoid chasing a parabolic extension.
Trim into new highs while RSI/extension remains extreme; progressively heavier trimming on further Fibonacci-style extensions above the breakout as reversion risk rises.
As of May 22, 2026, DGXX (Digi Power X Inc.) is in a parabolic state on the weekly chart with 76% confidence. Weekly breakout/vertical impulse to ~$7.93 with extreme volume expansion; price far above all key MAs; RSI-14 ~79.9 (overbought).
On the weekly timeframe, DGXX has key support at $6.40 and key resistance at $8.80. The most likely scenario (bullish) targets $8.80 and $10.5, with a revert level at $6.40.
DGXX (Digi Power X Inc.) is currently classified as parabolic on the weekly chart, with 76% confidence. Confirmation requires: 2+ weekly closes holding above ~$6.40 would confirm a sustained parabola rather than a one-week blow-off. This would be invalidated by: Weekly close back below ~$4.00 (near EMA20 ~$4.02) would invalidate the parabolic continuation and signal a deeper mean-reversion phase.
The most likely scenario (bullish) targets $8.80 and $10.5, with a revert level at $6.40. The alternative scenario (bearish) targets $5.60 and $4.00.
Multi-layer AI agents analyse 200+ stocks across daily, weekly, and monthly timeframes — producing market state classifications, price scenarios with targets, and position entry/exit levels. Daily charts updated every trading day at 6 PM ET. Weekly charts refresh Fridays. Monthly charts refresh on the last trading day of each month. No paywall. No sign-up required.
Built by Foliotrail.
All content on this website — including charts, analysis, price targets, support/resistance levels, and position zones — is generated entirely by AI and provided for educational and informational purposes only.
This is not financial advice. NEXUSNOIR VENTURES SL (the operator of this website) is not a registered investment adviser or broker-dealer. You should not make investment decisions based solely on this information. Always do your own research and consult a qualified financial advisor.
By continuing, you acknowledge that you have read and agree to our full disclaimer & terms of use and privacy policy.