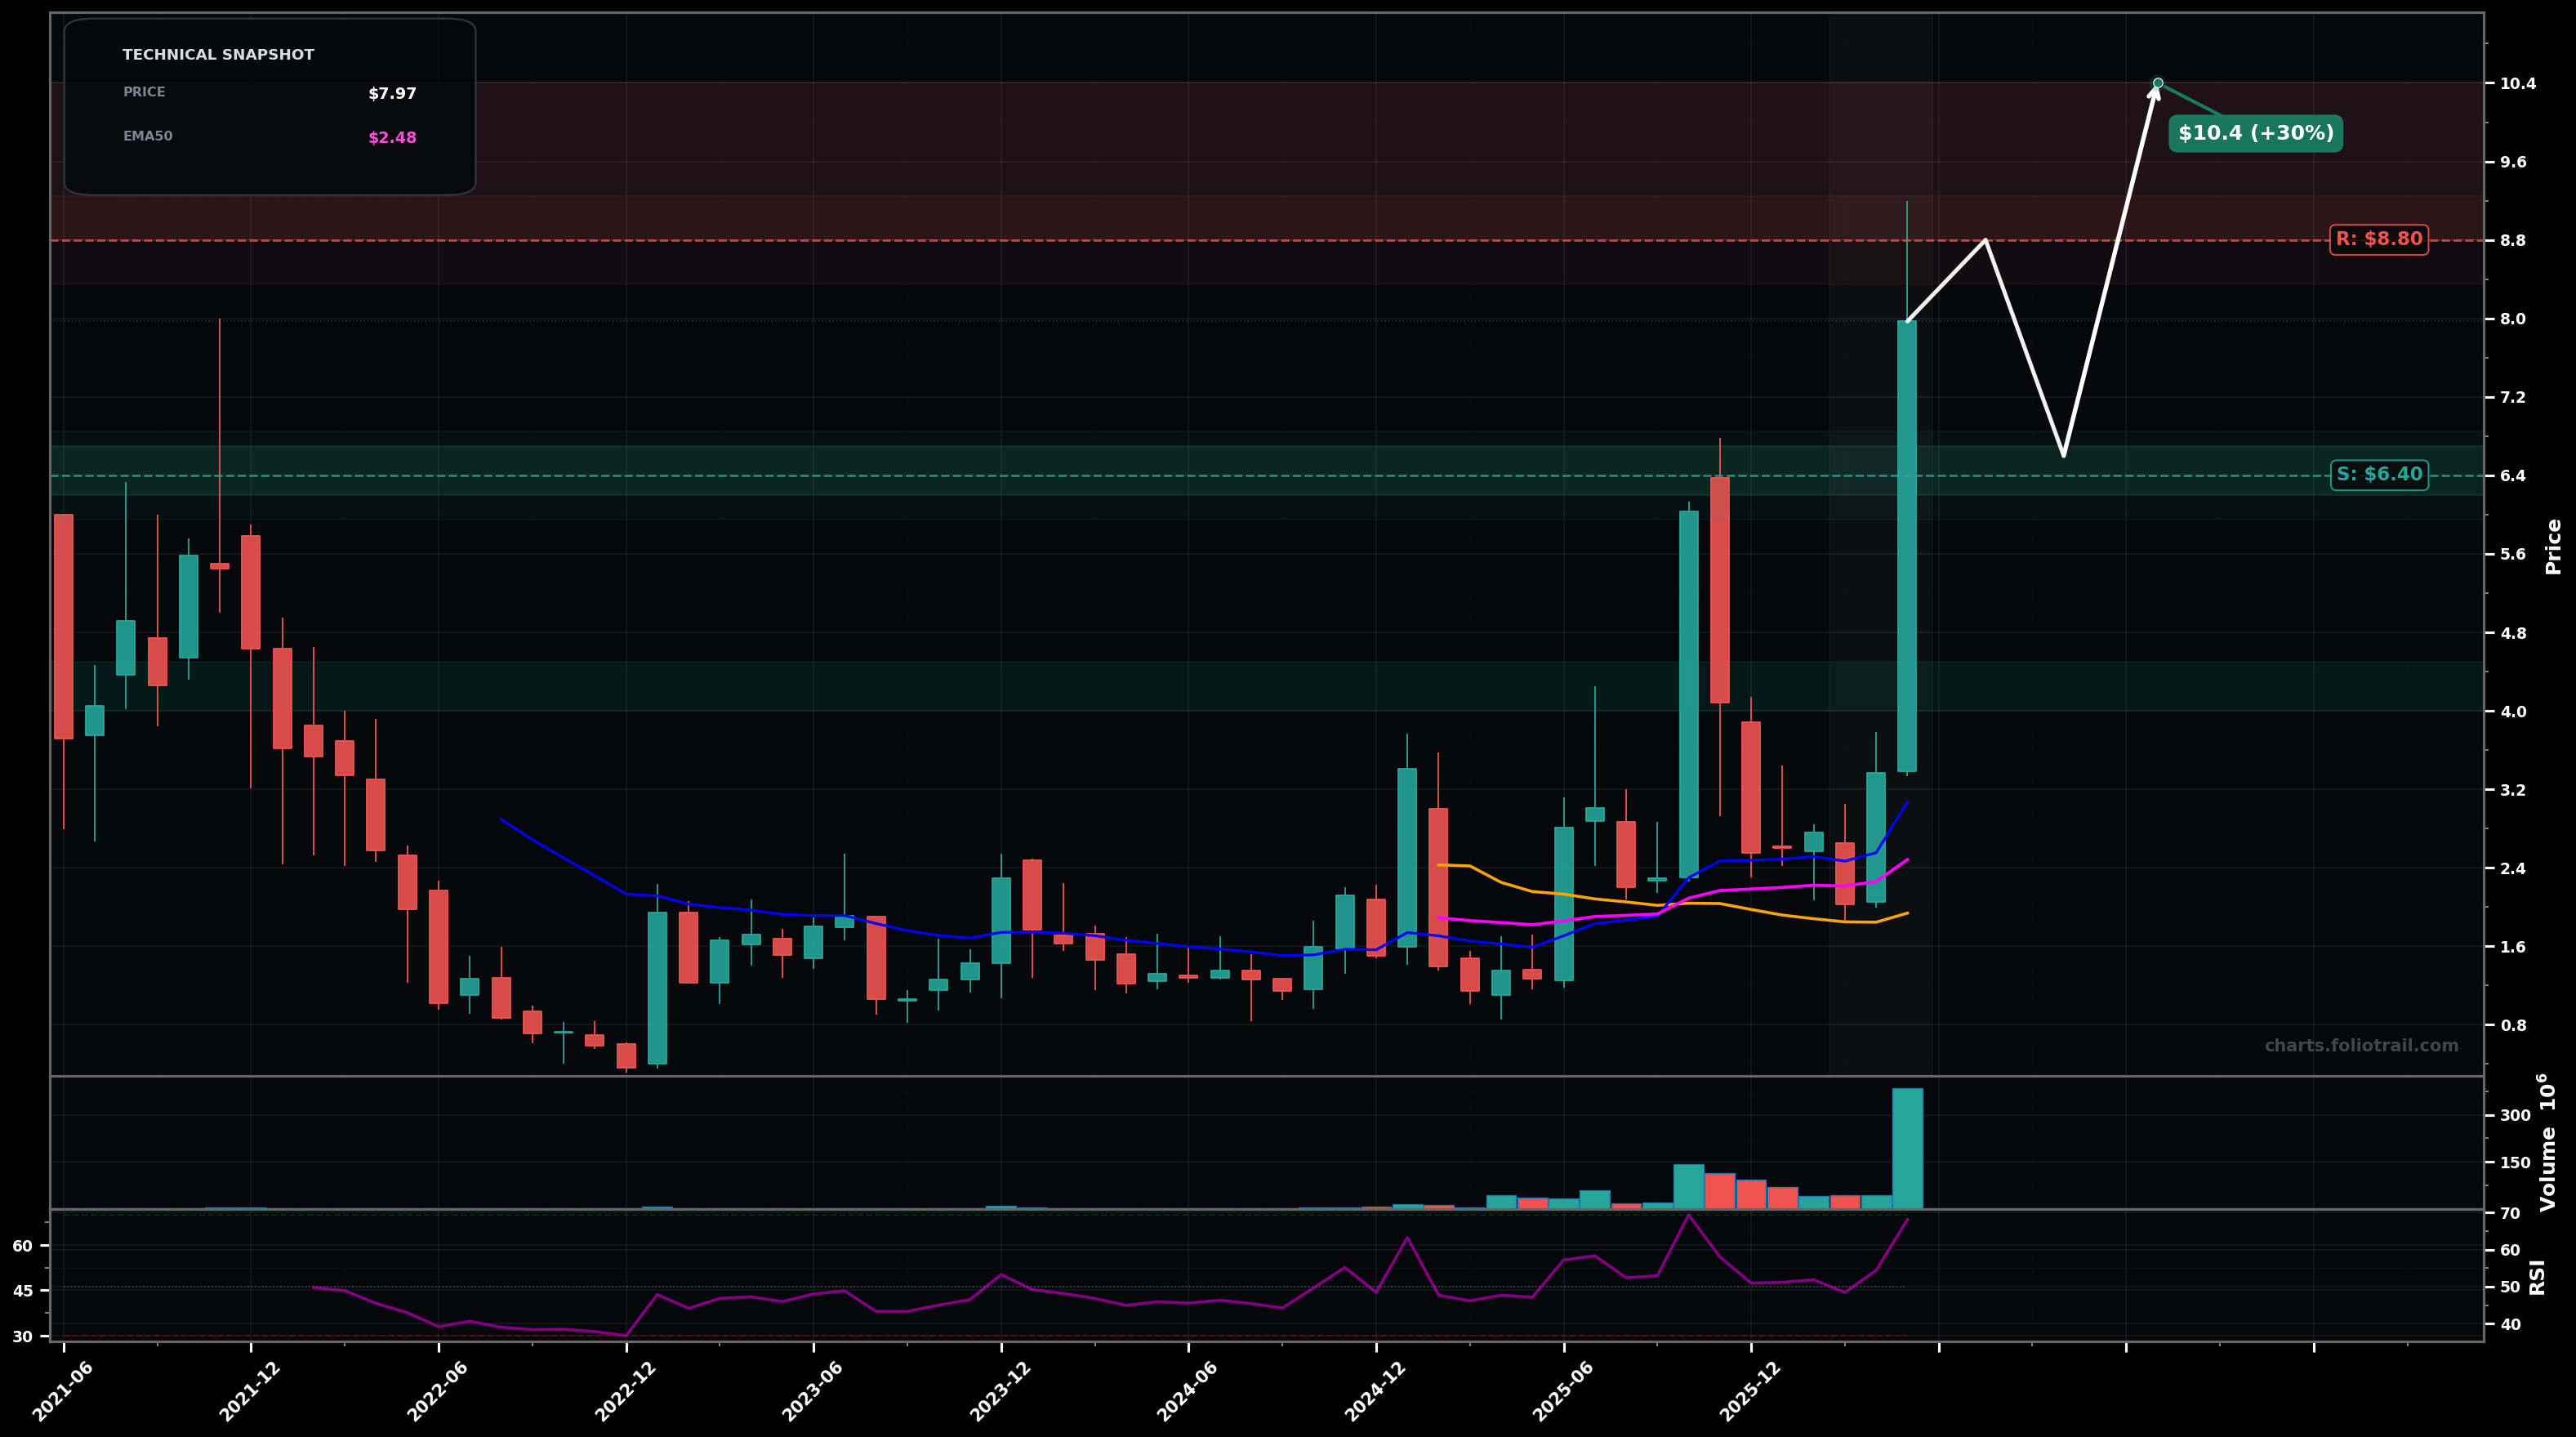
As of May 22, 2026, DGXX (Digi Power X Inc.) is in a parabolic state on the monthly chart, with a confidence level of 66%. Key support is at $6.40 and key resistance at $8.80. Monthly breakout with a near-vertical impulse candle to ~$7.97 on a major volume spike; price is far above EMA50 (~$2.48) and EMA200 (~$3.07) after reclaiming the long base range.
Bullish continuation after a controlled pullback: price digests the spike (likely retracing toward the breakout zone), then attempts a higher high. Elliott-wave read: this looks like an impulsive Wave 3; next is a Wave 4 consolidation before a Wave 5 push. Fib guide (using the impulse leg into ~$8+): a typical Wave-4 retrace is ~23.6%–38.2%, aligning with mid-$6s to mid-$5s.
Sharp mean-reversion: the parabolic candle fails and price retraces deeper into the prior congestion/MA cluster. Elliott-wave alternative: the spike was a terminal Wave 5 / news-driven blow-off, leading to an ABC correction back toward the pre-breakout structure. Fib: deeper 50%–61.8% retrace of the impulse can tag the low-$5s to low-$4s, especially if volume fades and a large red close near lows prints.
2 monthly closes holding above ~$6.40
Monthly close back below ~$5.60
Stage entries at the breakout retest ($6.2–$6.7), then deeper Fib/structure support ($5.4–$5.9), with heavy adds only if a full ABC mean-reversion tags prior demand near ~$4–$4.5.
Trim into likely Wave-5/extension zones above the prior spike high (first $8.8–$10.4), reduce more on a momentum extension ($10.4–$12.8), and fully close if price enters multi-year stretched territory ($12.8+), especially if monthly RSI pushes into >75 or a reversal candle prints.
As of May 22, 2026, DGXX (Digi Power X Inc.) is in a parabolic state on the monthly chart with 66% confidence. Monthly breakout with a near-vertical impulse candle to ~$7.97 on a major volume spike; price is far above EMA50 (~$2.48) and EMA200 (~$3.07) after reclaiming the long base range.
On the monthly timeframe, DGXX has key support at $6.40 and key resistance at $8.80. The most likely scenario (bullish) targets $8.80 and $10.4, with a revert level at $6.60.
DGXX (Digi Power X Inc.) is currently classified as parabolic on the monthly chart, with 66% confidence. Confirmation requires: 2 monthly closes holding above ~$6.40 This would be invalidated by: Monthly close back below ~$5.60
The most likely scenario (bullish) targets $8.80 and $10.4, with a revert level at $6.60. The alternative scenario (bearish) targets $5.60 and $4.20.
Multi-layer AI agents analyse 200+ stocks across daily, weekly, and monthly timeframes — producing market state classifications, price scenarios with targets, and position entry/exit levels. Daily charts updated every trading day at 6 PM ET. Weekly charts refresh Fridays. Monthly charts refresh on the last trading day of each month. No paywall. No sign-up required.
Built by Foliotrail.
All content on this website — including charts, analysis, price targets, support/resistance levels, and position zones — is generated entirely by AI and provided for educational and informational purposes only.
This is not financial advice. NEXUSNOIR VENTURES SL (the operator of this website) is not a registered investment adviser or broker-dealer. You should not make investment decisions based solely on this information. Always do your own research and consult a qualified financial advisor.
By continuing, you acknowledge that you have read and agree to our full disclaimer & terms of use and privacy policy.