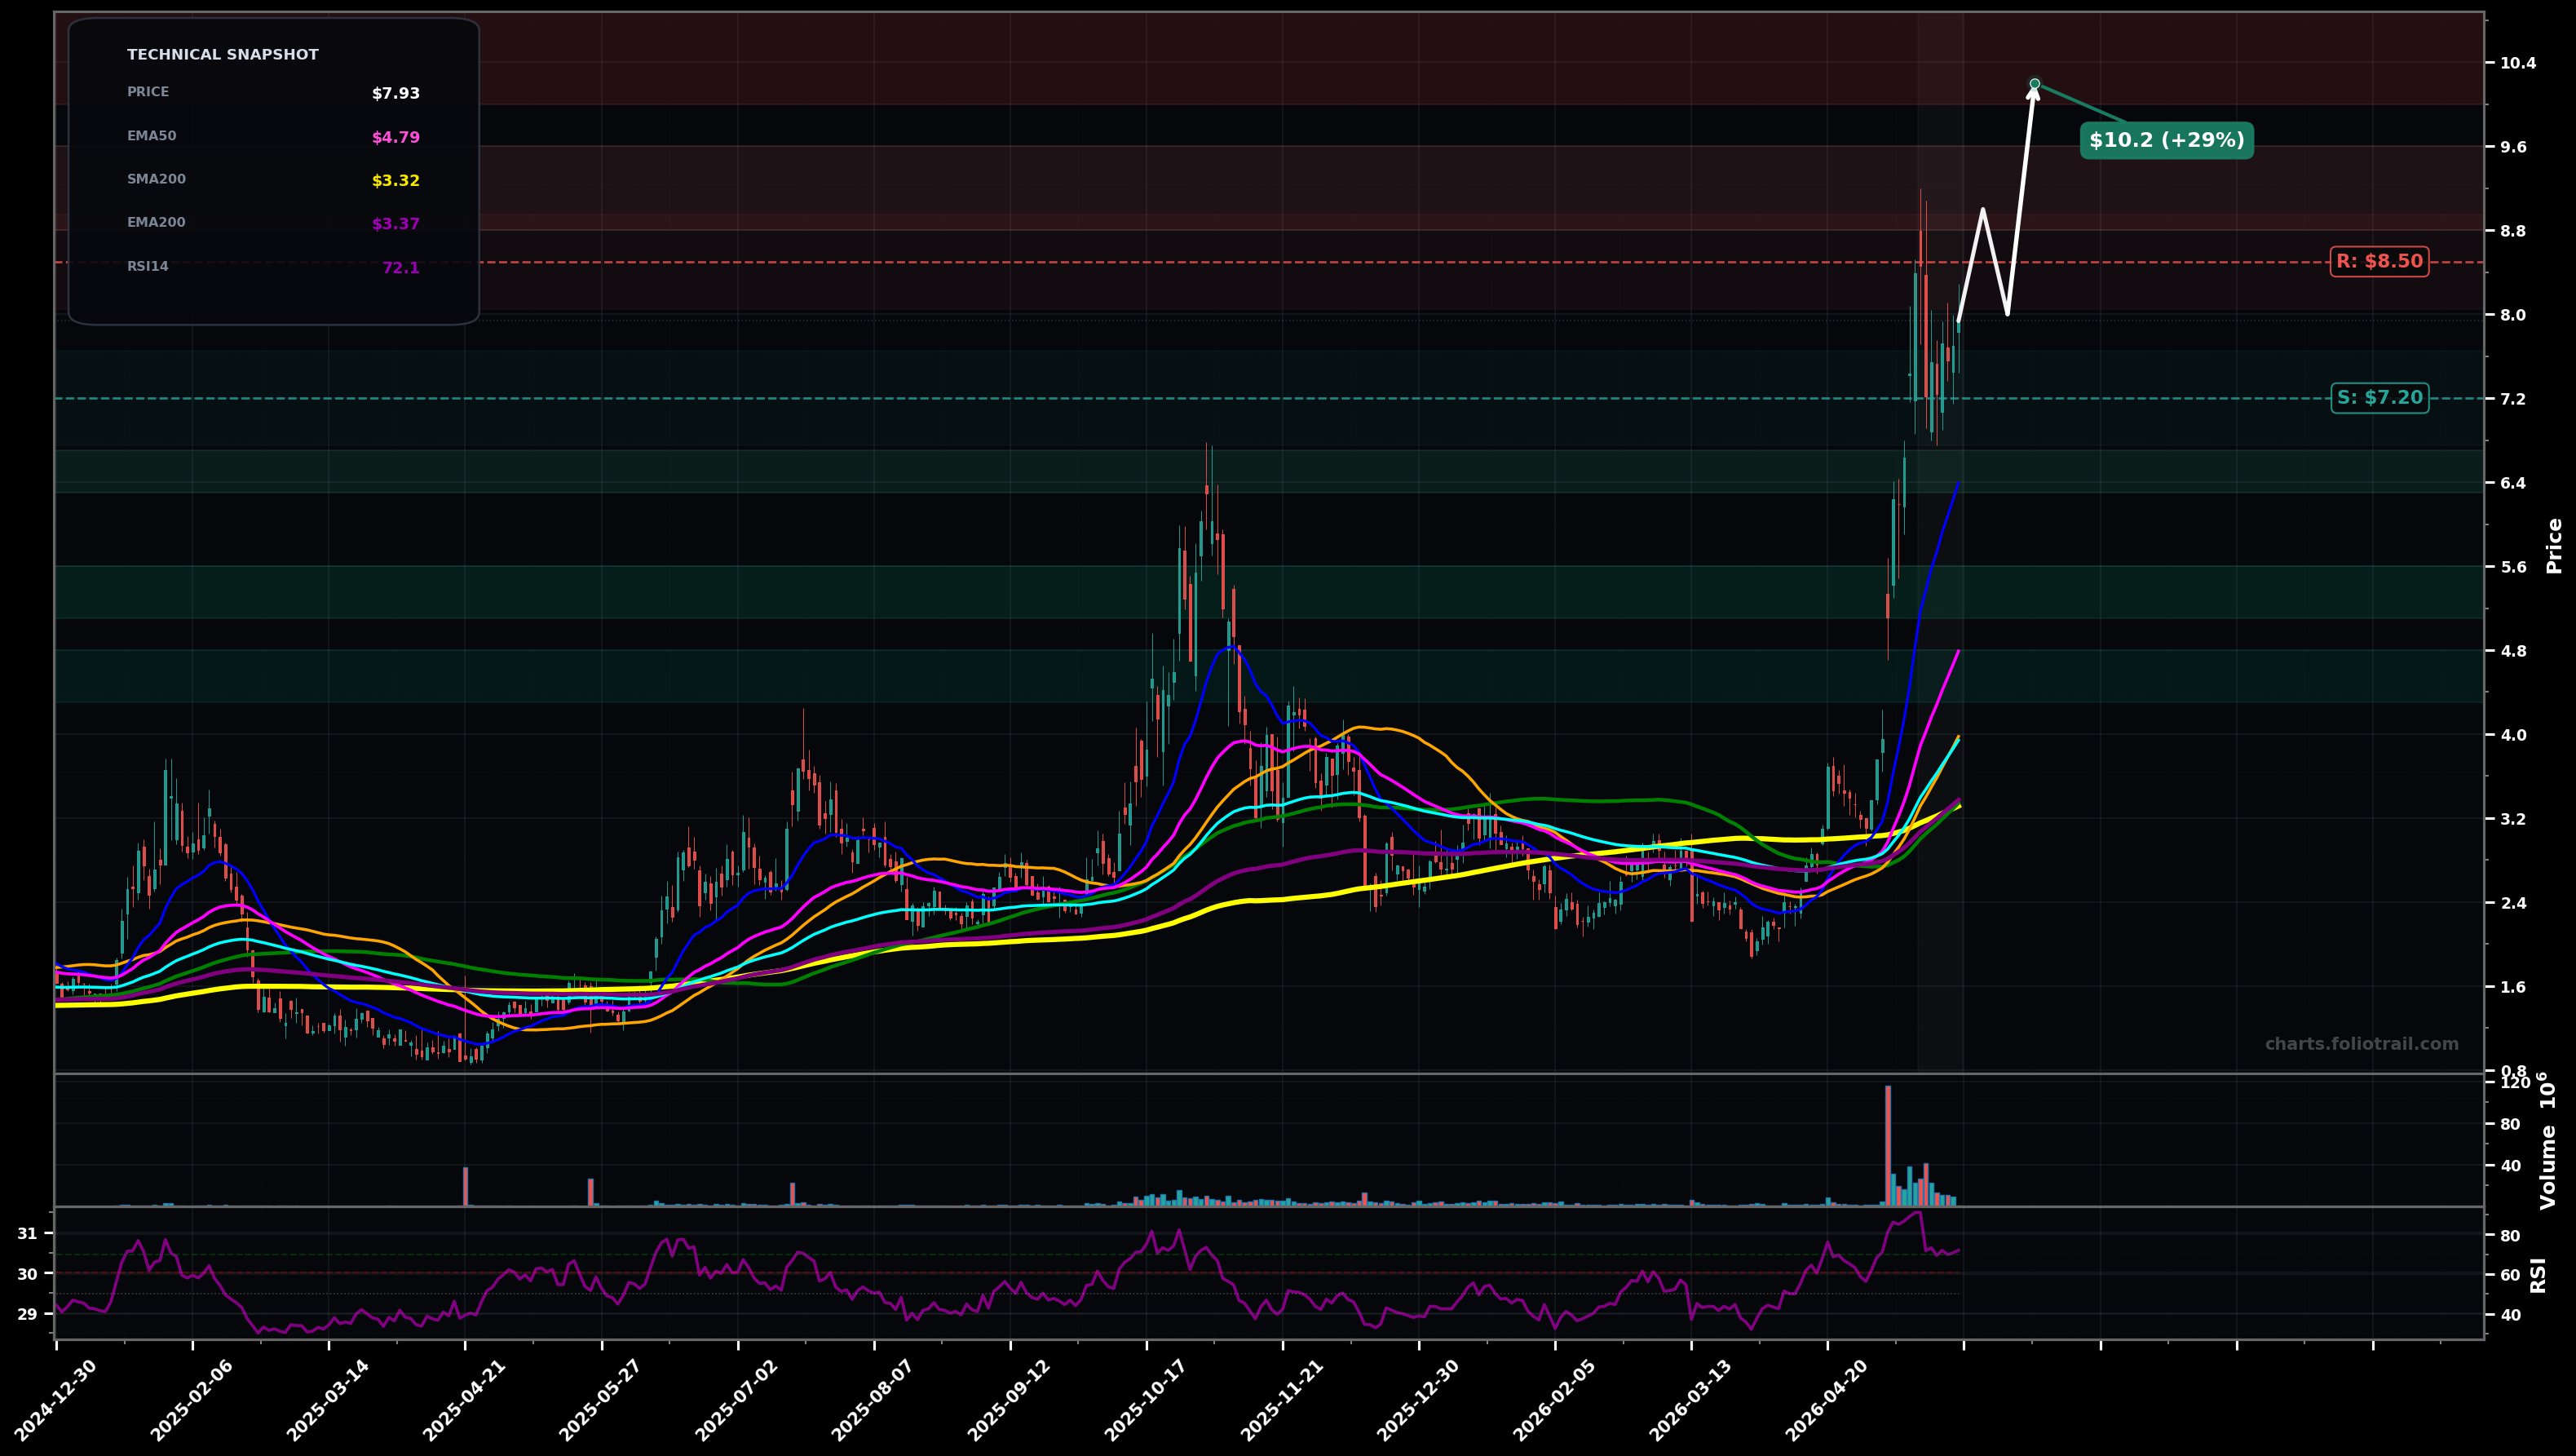
As of May 22, 2026, DGXX (Digi Power X Inc.) is in a parabolic state on the daily chart, with a confidence level of 74%. Key support is at $7.20 and key resistance at $8.50. Sharp impulse breakout from the $2.4–$3.0 base into a vertical run toward ~$9, then tight consolidation around $7–$8 with RSI still elevated (~72).
Bullish continuation: consolidation resolves upward (parabolic can extend) with a push through $8.50 and a retest/hold above the breakout area before another leg higher; treat as late-wave extension risk.
Mean-reversion pullback: price rejects $8.5–$9 zone and retraces toward the rising EMA20/EMA50 area; still constructive if it forms a higher low and reclaims $7.50 quickly.
Daily close above $8.50 followed by another close holding >$8.50
Daily close below $6.90 (loss of the post-spike base/last consolidation lows)
Zones align with likely pullback path into prior breakout shelf (~$6.5), then EMA50 vicinity (~$4.8–$5.6) while keeping structure bullish if HL forms (Elliott: Wave 4-type retrace after an extended Wave 3).
Trim into strength near psychological/extension levels after a parabolic leg; further trimming on new blow-off extensions as distance to EMA50/100 becomes extreme (high reversal/air-pocket risk).
As of May 22, 2026, DGXX (Digi Power X Inc.) is in a parabolic state on the daily chart with 74% confidence. Sharp impulse breakout from the $2.4–$3.0 base into a vertical run toward ~$9, then tight consolidation around $7–$8 with RSI still elevated (~72).
On the daily timeframe, DGXX has key support at $7.20 and key resistance at $8.50. The most likely scenario (bullish) targets $9.00 and $10.2, with a revert level at $8.00.
DGXX (Digi Power X Inc.) is currently classified as parabolic on the daily chart, with 74% confidence. Confirmation requires: Daily close above $8.50 followed by another close holding >$8.50 This would be invalidated by: Daily close below $6.90 (loss of the post-spike base/last consolidation lows)
The most likely scenario (bullish) targets $9.00 and $10.2, with a revert level at $8.00. The alternative scenario (bearish) targets $6.40 and $5.10.
Multi-layer AI agents analyse 200+ stocks across daily, weekly, and monthly timeframes — producing market state classifications, price scenarios with targets, and position entry/exit levels. Daily charts updated every trading day at 6 PM ET. Weekly charts refresh Fridays. Monthly charts refresh on the last trading day of each month. No paywall. No sign-up required.
Built by Foliotrail.
All content on this website — including charts, analysis, price targets, support/resistance levels, and position zones — is generated entirely by AI and provided for educational and informational purposes only.
This is not financial advice. NEXUSNOIR VENTURES SL (the operator of this website) is not a registered investment adviser or broker-dealer. You should not make investment decisions based solely on this information. Always do your own research and consult a qualified financial advisor.
By continuing, you acknowledge that you have read and agree to our full disclaimer & terms of use and privacy policy.