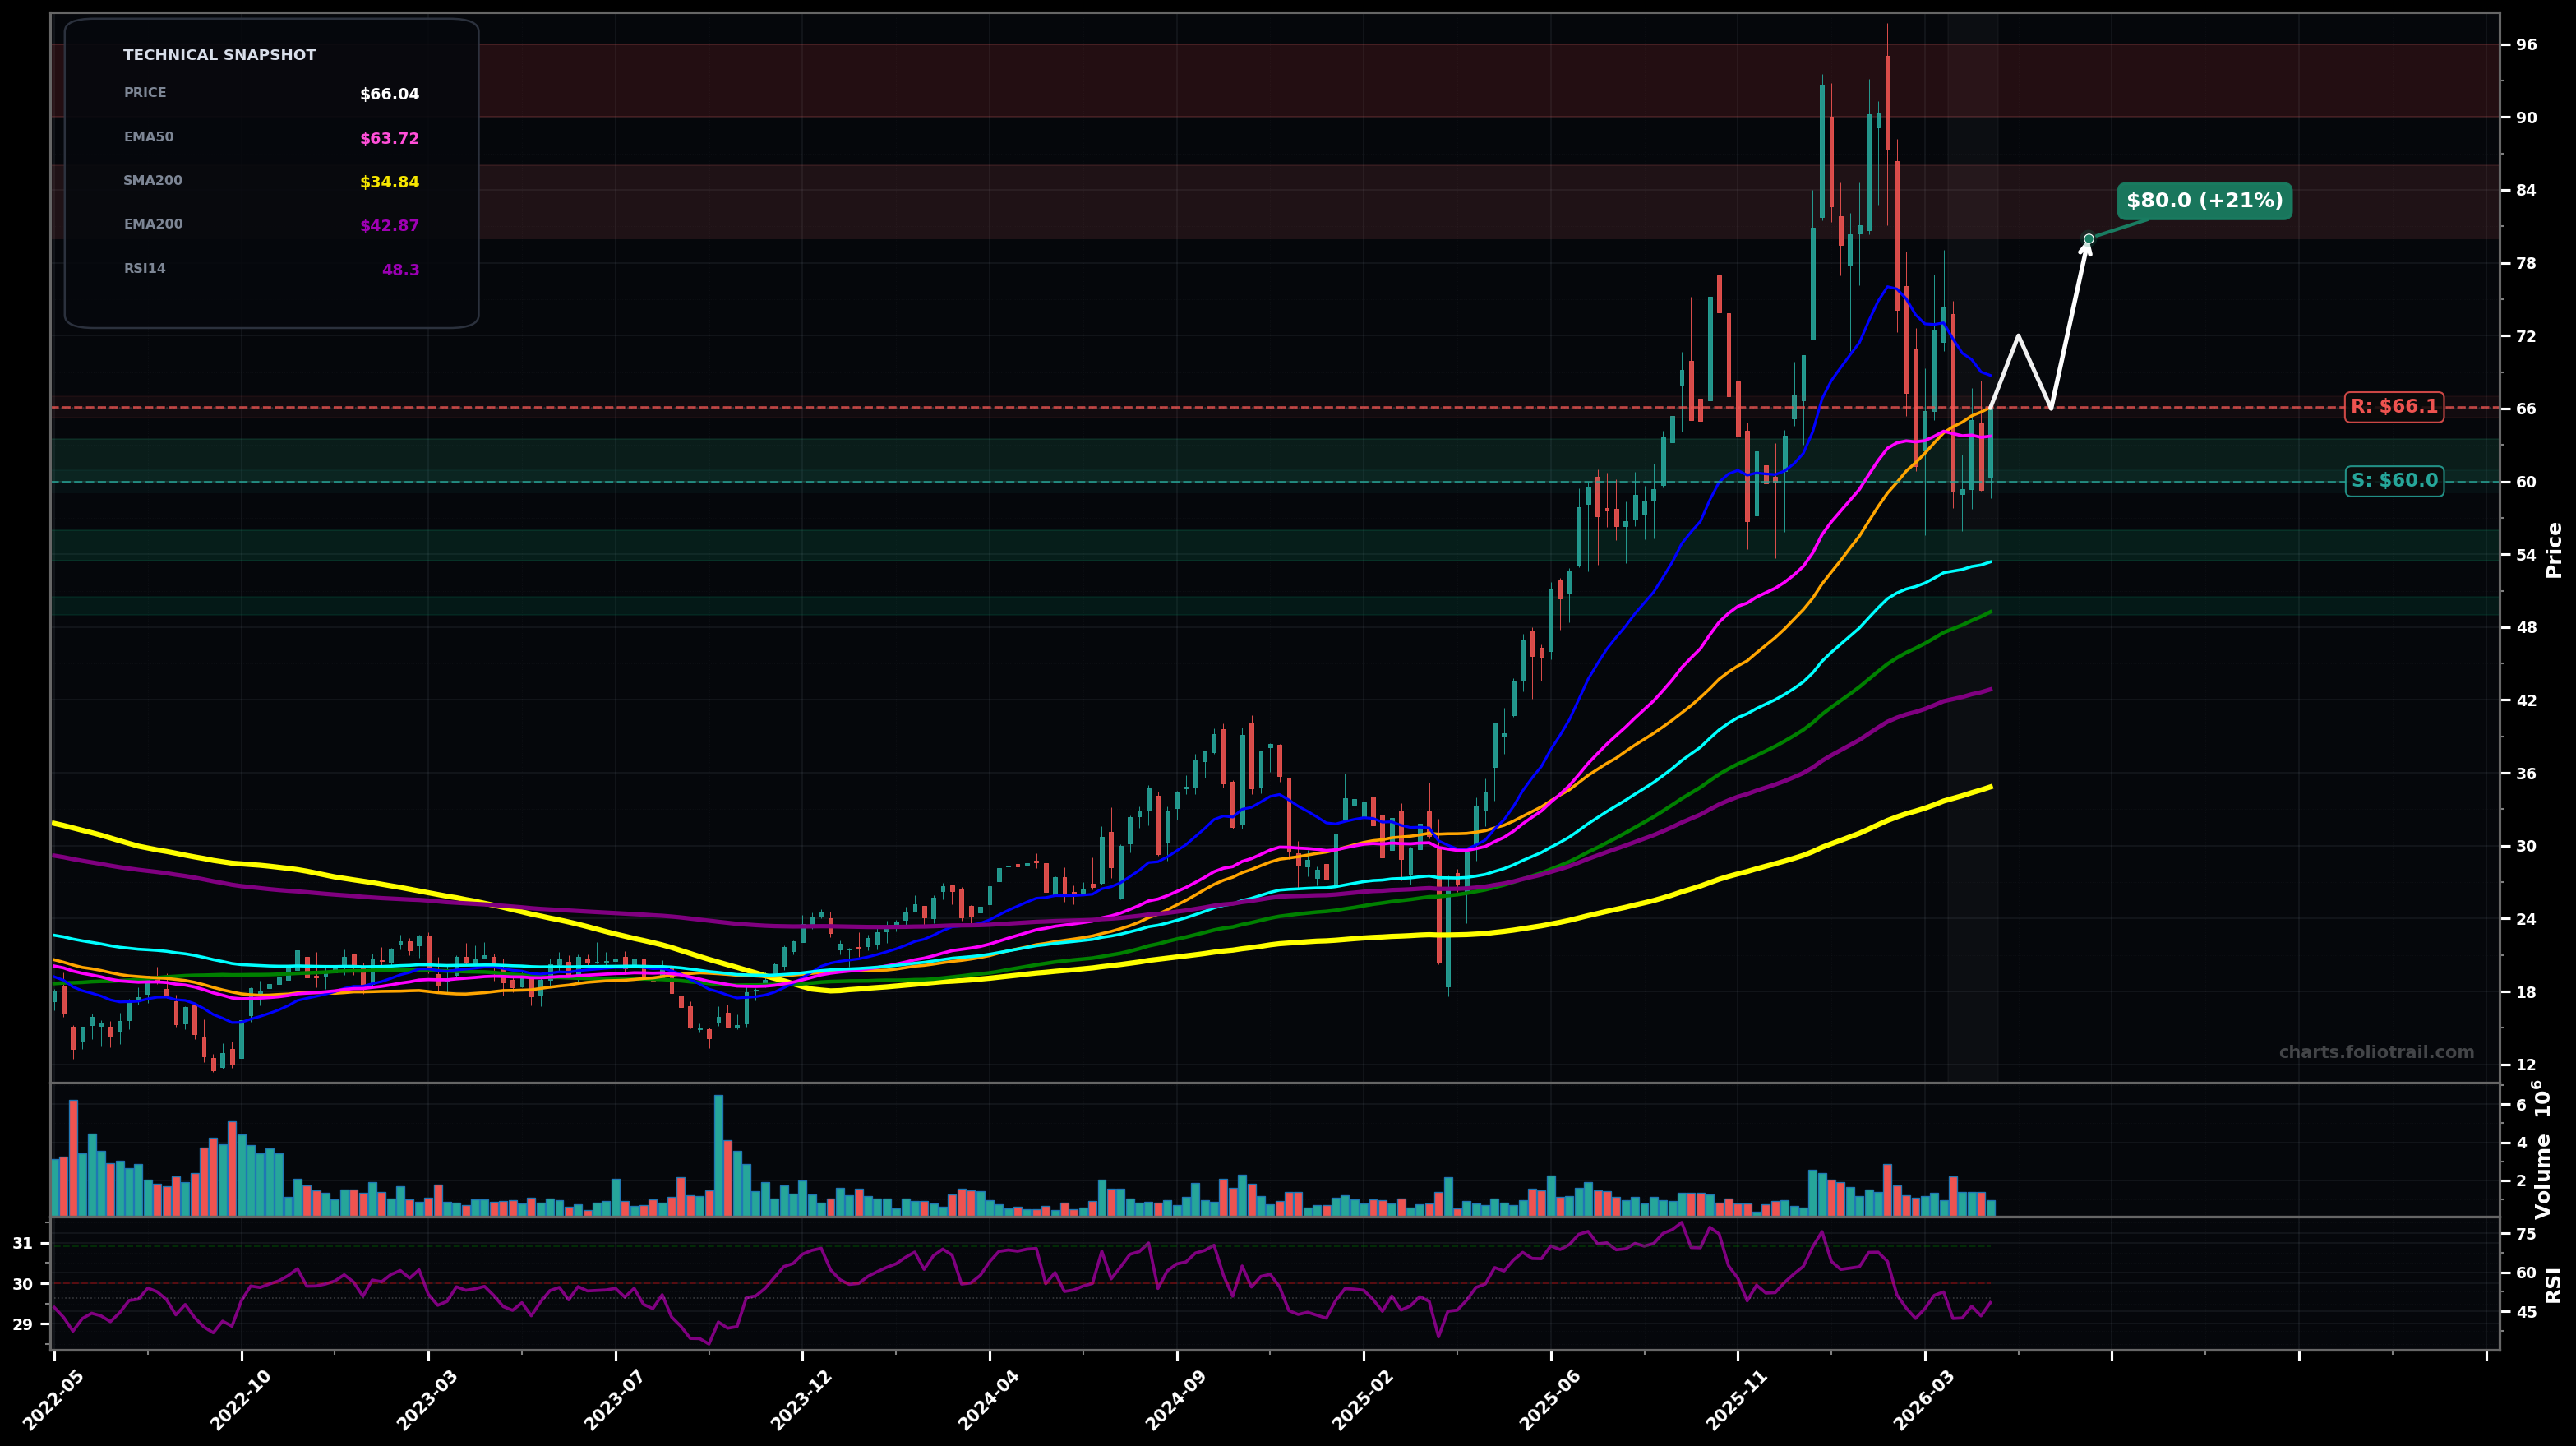
As of May 22, 2026, DFEN (Direxion Daily Aerospace & Defense Bull 3X Shares) is in a volatility expansion state on the weekly chart, with a confidence level of 66%. Key support is at $60.0 and key resistance at $66.1. Weekly pullback from the ~$90s into the ~$60–$66 area; price sitting near SMA50/EMA50 cluster with RSI ~48 (neutral).
Base-building above the $60 swing-low zone, then reclaim/hold above the $66–$69 MA cluster to restart the larger uptrend (wave-4 type consolidation after a strong wave-3 advance). Prob ~60%.
Support fails: lose $60, triggering a deeper mean-reversion toward the rising higher-timeframe averages (EMA100/SMA100 area), consistent with a larger ABC correction from the ~$90s high. Prob ~40%.
State confirmed if weekly ranges keep expanding and price breaks either below $60 or above $72 with follow-through (2 weekly closes).
Invalidated if price compresses and holds a tight range above $63–$66 for ~4+ weeks (volatility contraction/base).
Start near the ~$60 pivot/round-number support; add on pullback into EMA100 (~$53) area; heavy add near SMA100 (~$49) if the correction deepens but the long-term MA stack remains rising.
Trim into prior supply/failed-high zone ($80–$96); fully exit on an overshoot above prior ATH area where upside becomes increasingly asymmetric vs mean-reversion risk.
As of May 22, 2026, DFEN (Direxion Daily Aerospace & Defense Bull 3X Shares) is in a volatility expansion state on the weekly chart with 66% confidence. Weekly pullback from the ~$90s into the ~$60–$66 area; price sitting near SMA50/EMA50 cluster with RSI ~48 (neutral).
On the weekly timeframe, DFEN has key support at $60.0 and key resistance at $66.1. The most likely scenario (bullish) targets $72.0 and $80.0, with a revert level at $66.0.
DFEN (Direxion Daily Aerospace & Defense Bull 3X Shares) is currently classified as volatility expansion on the weekly chart, with 66% confidence. Confirmation requires: State confirmed if weekly ranges keep expanding and price breaks either below $60 or above $72 with follow-through (2 weekly closes). This would be invalidated by: Invalidated if price compresses and holds a tight range above $63–$66 for ~4+ weeks (volatility contraction/base).
The most likely scenario (bullish) targets $72.0 and $80.0, with a revert level at $66.0. The alternative scenario (bearish) targets $53.4 and $49.2.
Multi-layer AI agents analyse 200+ stocks across daily, weekly, and monthly timeframes — producing market state classifications, price scenarios with targets, and position entry/exit levels. Daily charts updated every trading day at 6 PM ET. Weekly charts refresh Fridays. Monthly charts refresh on the last trading day of each month. No paywall. No sign-up required.
Built by Foliotrail.
All content on this website — including charts, analysis, price targets, support/resistance levels, and position zones — is generated entirely by AI and provided for educational and informational purposes only.
This is not financial advice. NEXUSNOIR VENTURES SL (the operator of this website) is not a registered investment adviser or broker-dealer. You should not make investment decisions based solely on this information. Always do your own research and consult a qualified financial advisor.
By continuing, you acknowledge that you have read and agree to our full disclaimer & terms of use and privacy policy.