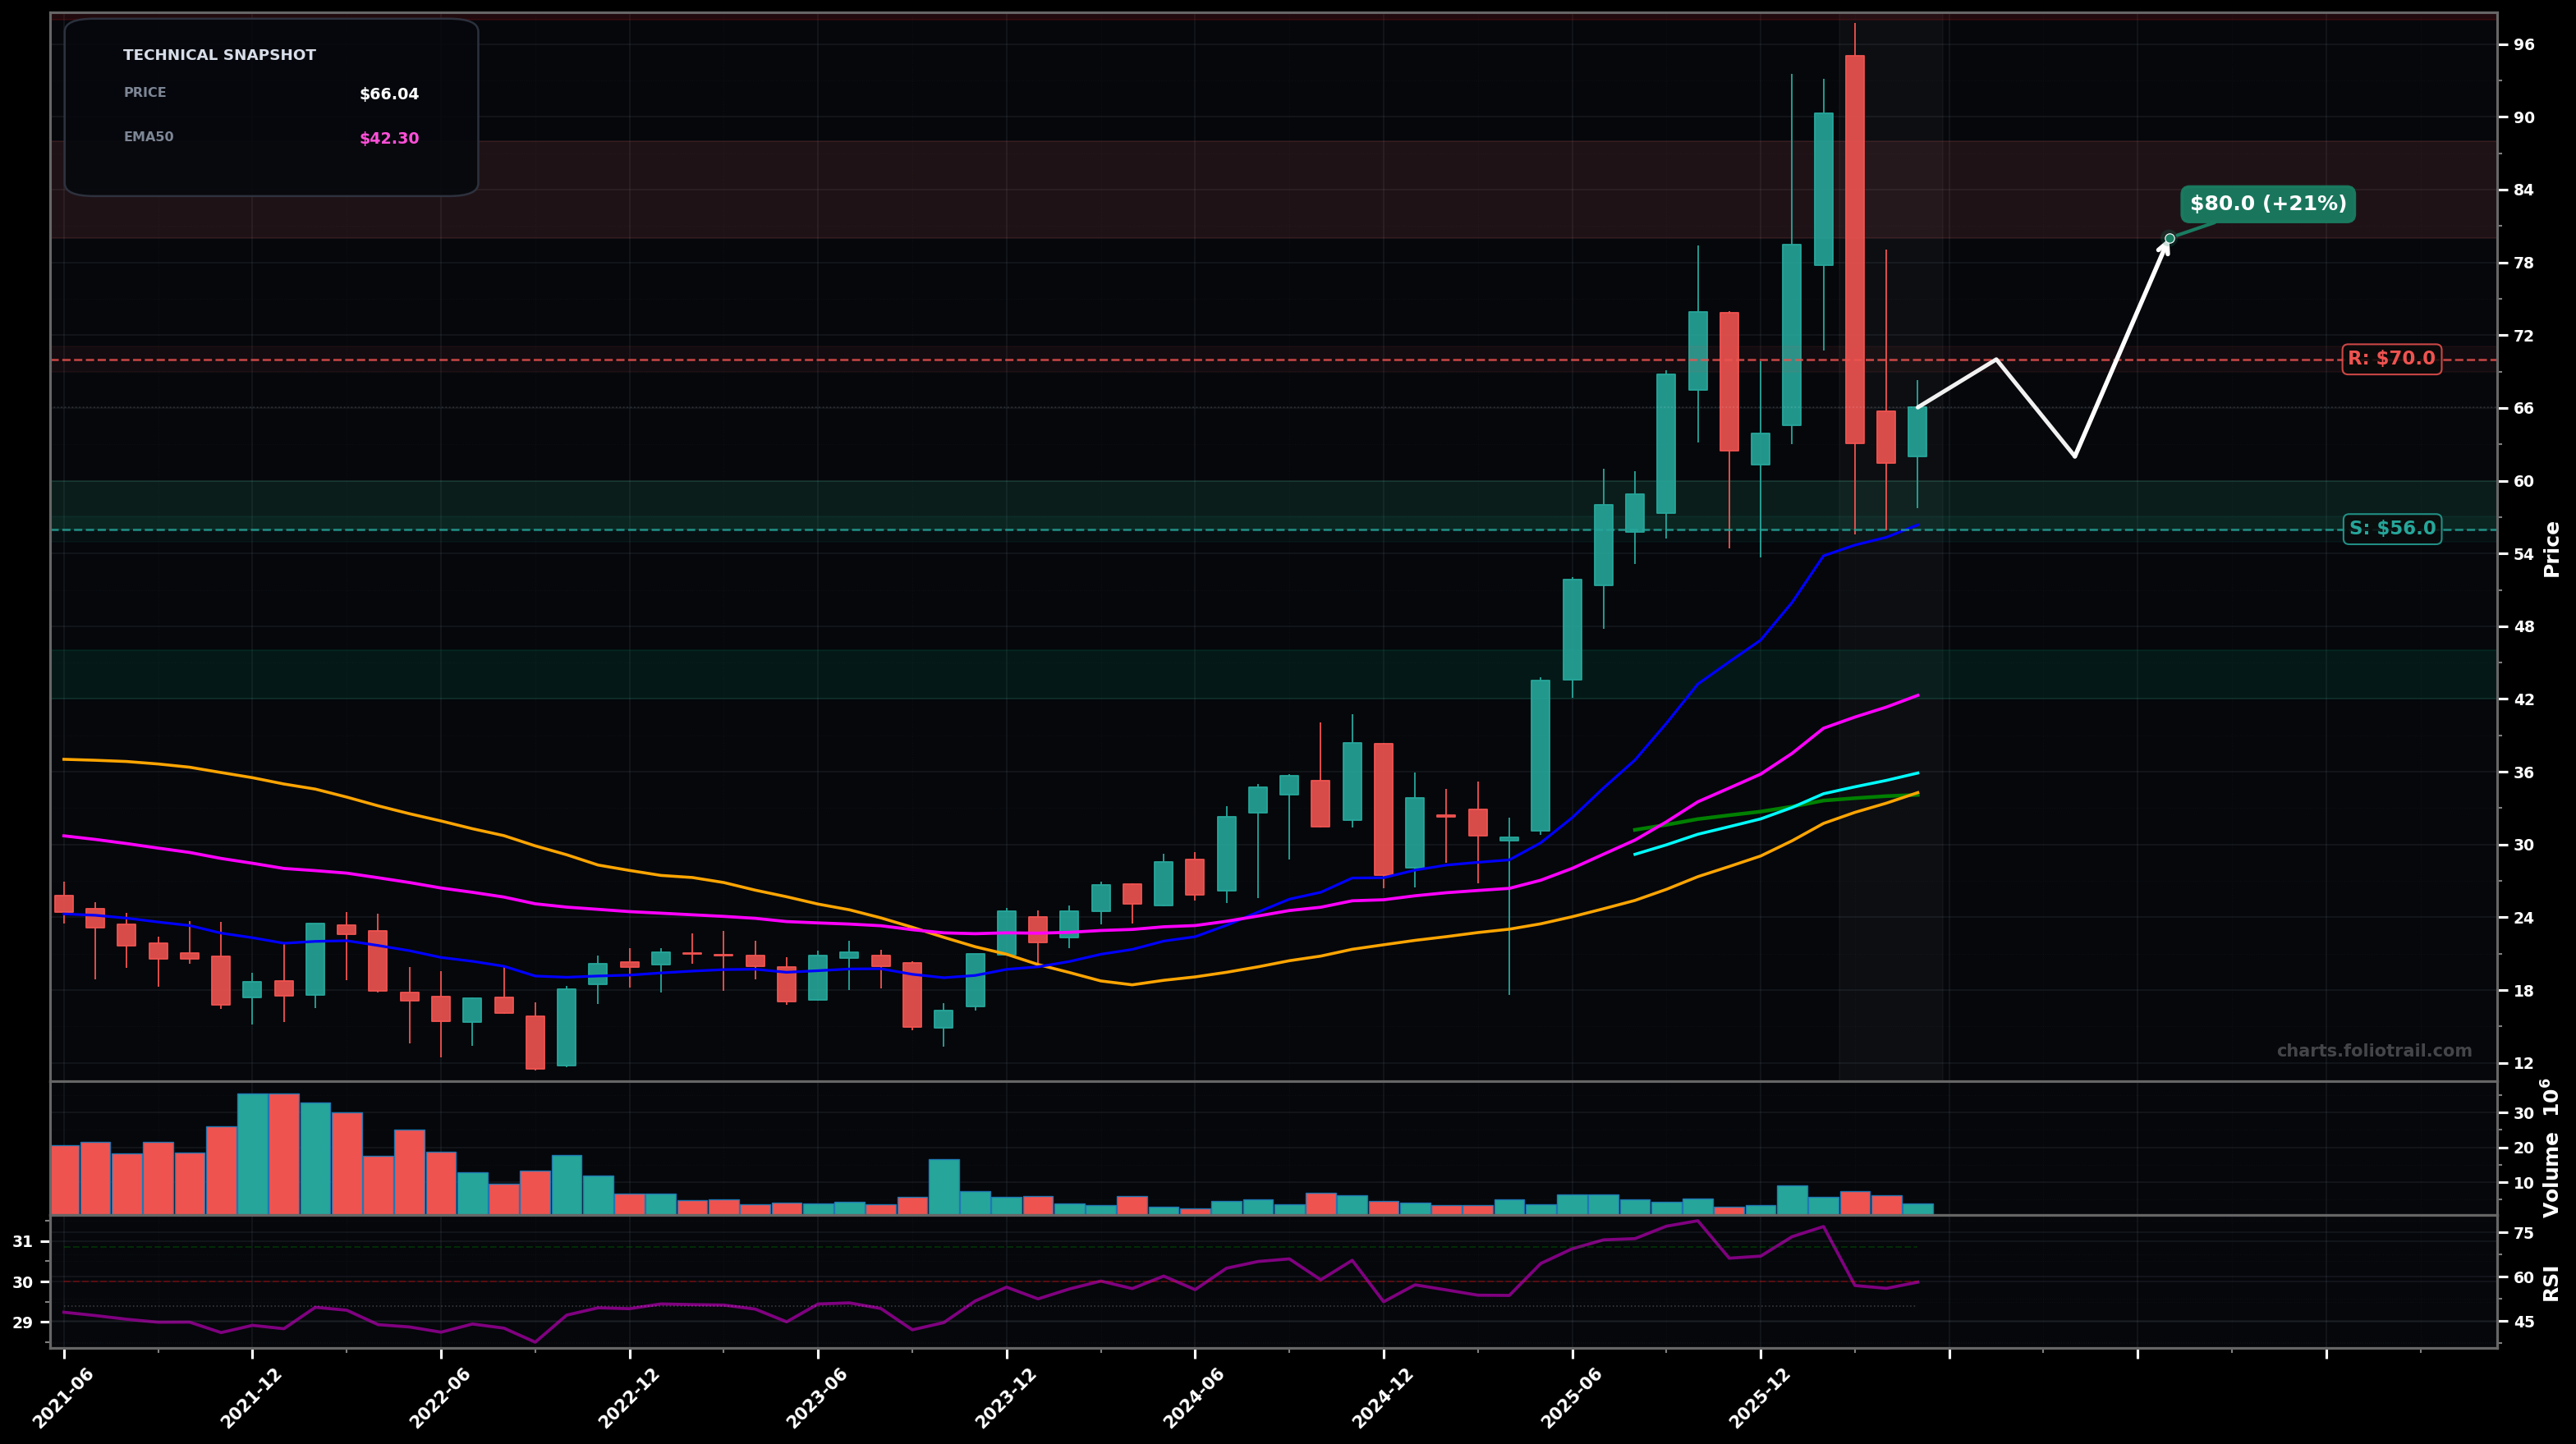
As of May 22, 2026, DFEN (Direxion Daily Aerospace & Defense Bull 3X Shares) is in a volatility expansion state on the monthly chart, with a confidence level of 67%. Key support is at $56.0 and key resistance at $70.0. Monthly uptrend paused after a sharp spike to the mid-$90s; pullback held above rising short/mid MAs and is consolidating around the mid-$60s.
Sideways-to-up consolidation: holds $56–$60 support, then reclaims $70 and grinds toward a retest of the prior supply zone (Fibonacci-style retrace of the drop).
Deeper pullback: failure to reclaim $70 leads to a breakdown under $56 and a mean-reversion move toward the rising EMA20/previous breakout area, then a bounce attempt.
2 monthly closes above $70 would confirm upside continuation out of the current consolidation.
A monthly close below $56 would invalidate the current post-spike stabilization and signal deeper mean reversion risk.
Start near post-spike base support ($56–$60); add on breakdown/flush to prior structure (~$50); heavy add at rising EMA50 area (~$42) where trend support should be strongest if the macro uptrend remains intact.
Trim into the prior blow-off supply zone ($80–$96) where reversals already appeared; consider full exit if price re-enters/extends beyond the extreme top zone (~$98+) as risk of another sharp mean-reversion increases.
As of May 22, 2026, DFEN (Direxion Daily Aerospace & Defense Bull 3X Shares) is in a volatility expansion state on the monthly chart with 67% confidence. Monthly uptrend paused after a sharp spike to the mid-$90s; pullback held above rising short/mid MAs and is consolidating around the mid-$60s.
On the monthly timeframe, DFEN has key support at $56.0 and key resistance at $70.0. The most likely scenario (bullish) targets $70.0 and $80.0, with a revert level at $62.0.
DFEN (Direxion Daily Aerospace & Defense Bull 3X Shares) is currently classified as volatility expansion on the monthly chart, with 67% confidence. Confirmation requires: 2 monthly closes above $70 would confirm upside continuation out of the current consolidation. This would be invalidated by: A monthly close below $56 would invalidate the current post-spike stabilization and signal deeper mean reversion risk.
The most likely scenario (bullish) targets $70.0 and $80.0, with a revert level at $62.0. The alternative scenario (bearish) targets $50.0 and $42.0.
Multi-layer AI agents analyse 200+ stocks across daily, weekly, and monthly timeframes — producing market state classifications, price scenarios with targets, and position entry/exit levels. Daily charts updated every trading day at 6 PM ET. Weekly charts refresh Fridays. Monthly charts refresh on the last trading day of each month. No paywall. No sign-up required.
Built by Foliotrail.
All content on this website — including charts, analysis, price targets, support/resistance levels, and position zones — is generated entirely by AI and provided for educational and informational purposes only.
This is not financial advice. NEXUSNOIR VENTURES SL (the operator of this website) is not a registered investment adviser or broker-dealer. You should not make investment decisions based solely on this information. Always do your own research and consult a qualified financial advisor.
By continuing, you acknowledge that you have read and agree to our full disclaimer & terms of use and privacy policy.