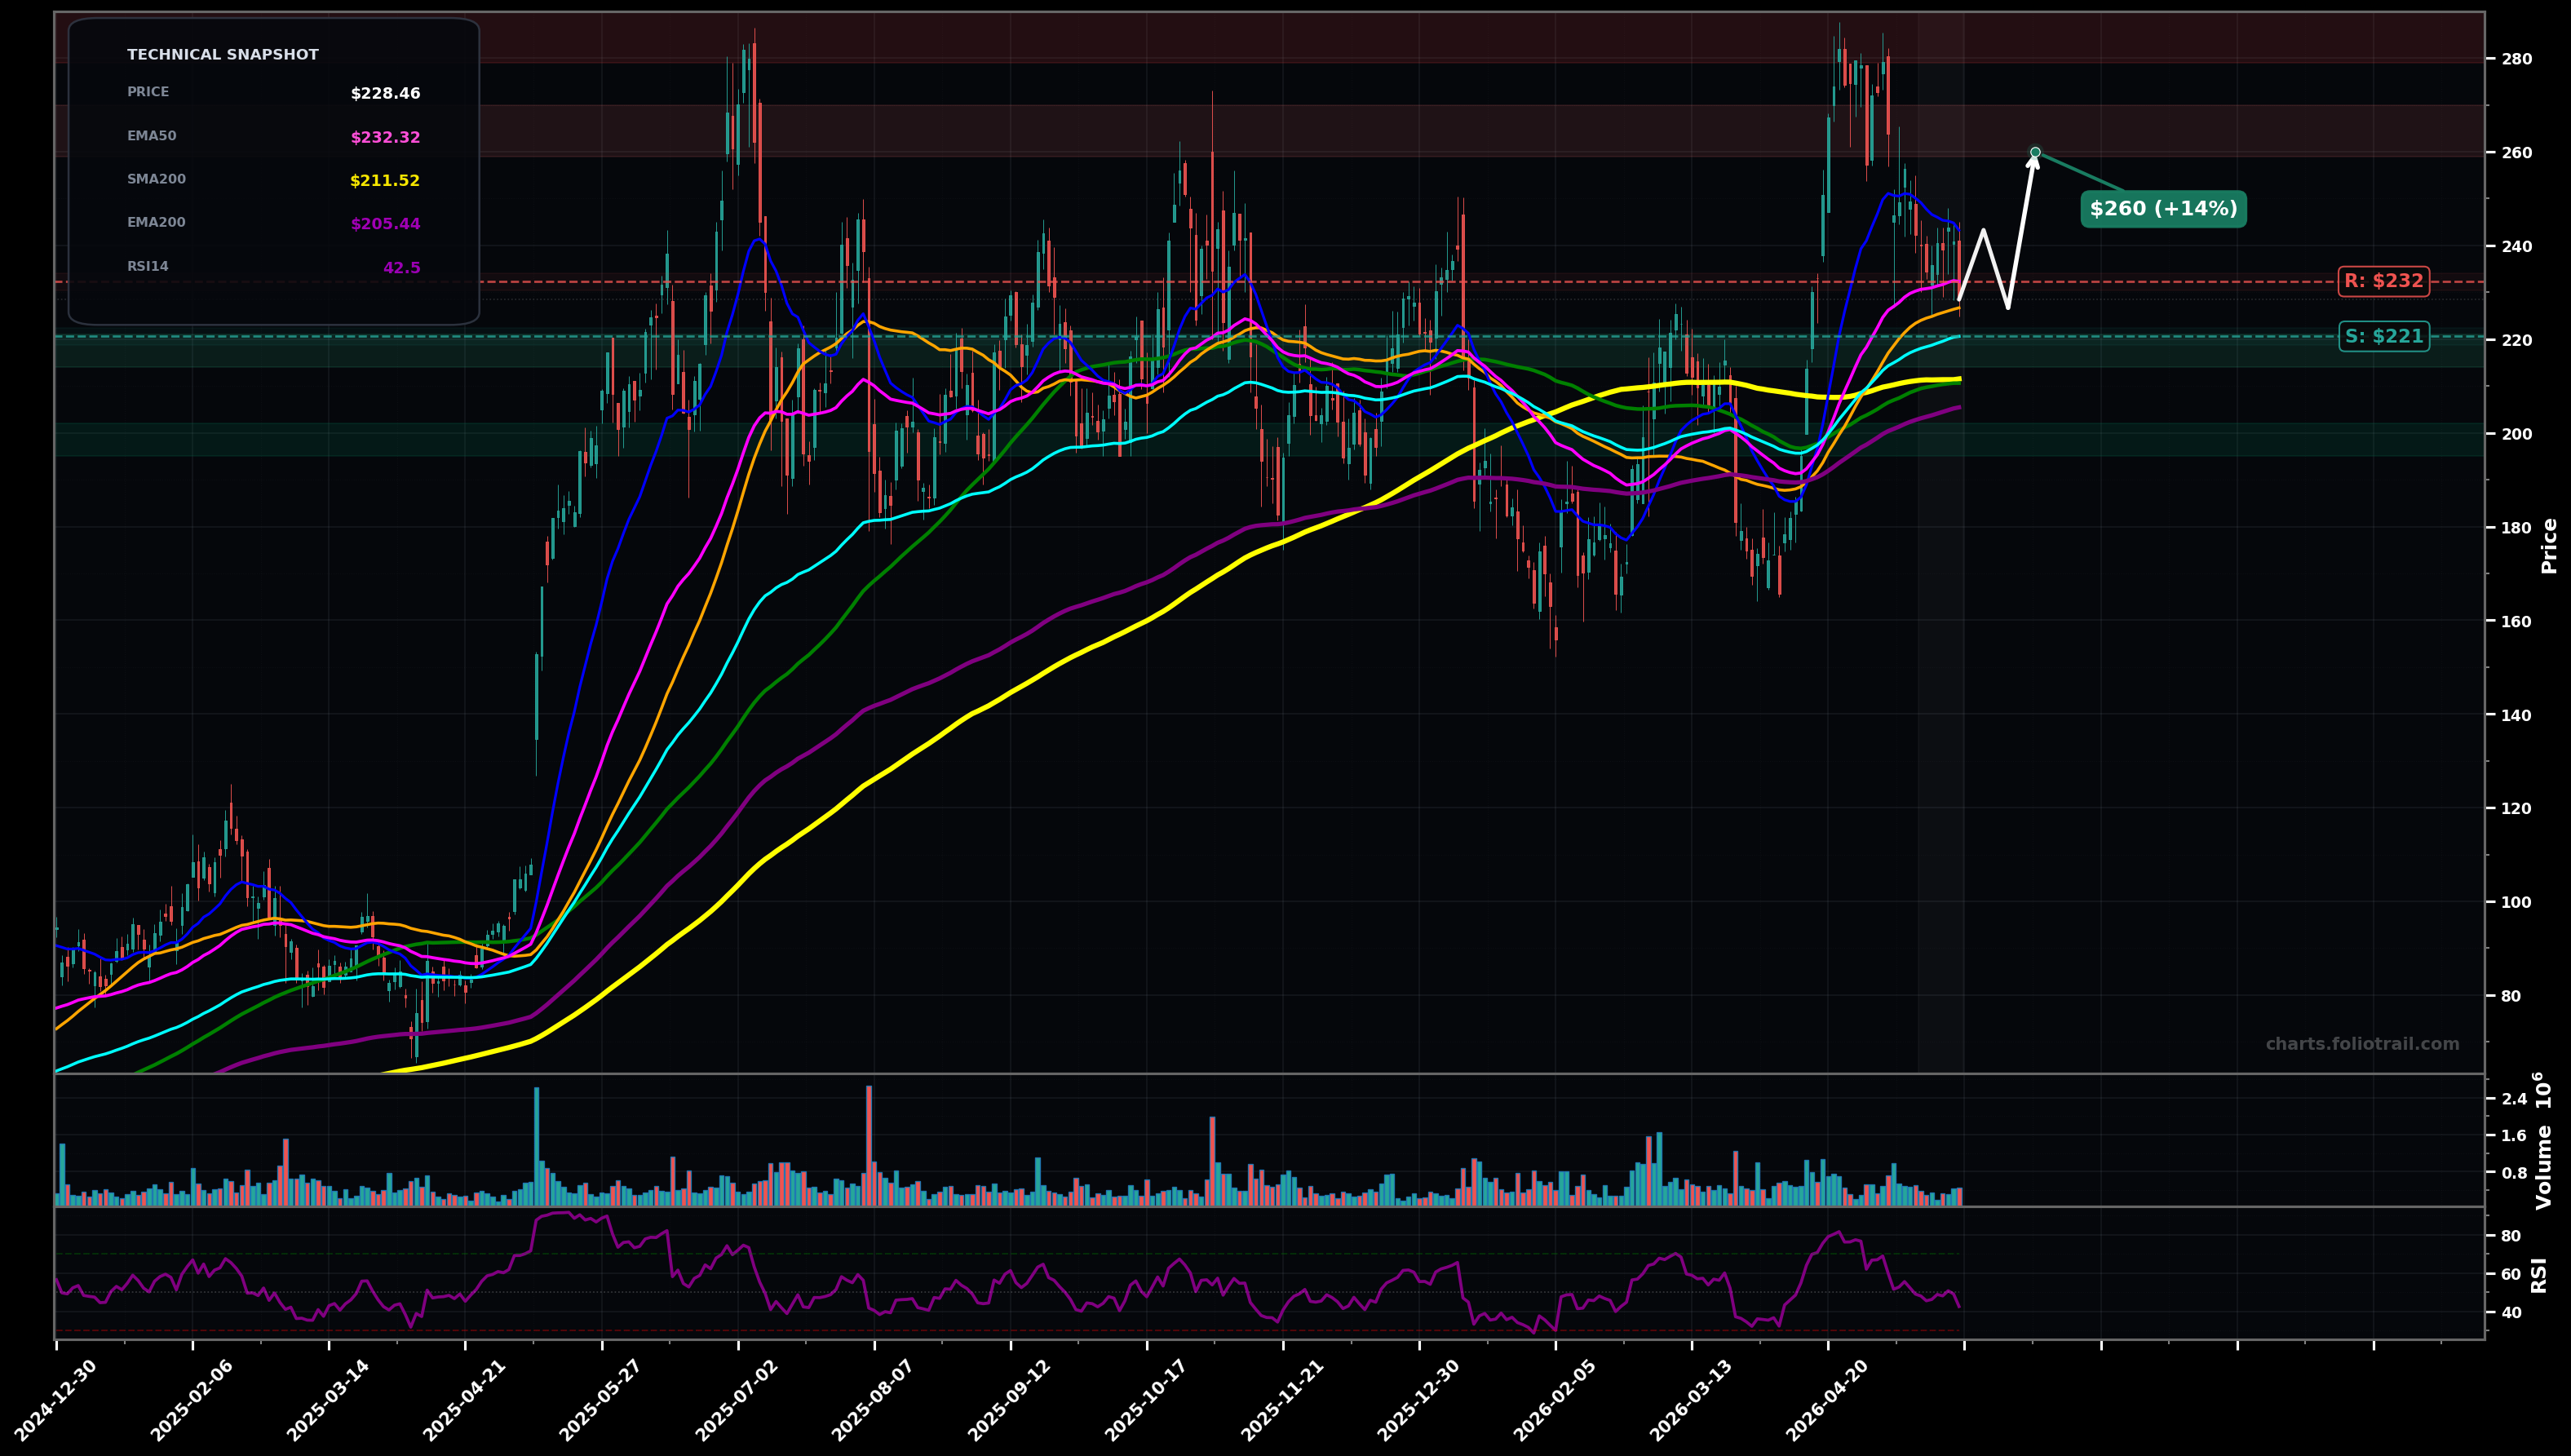
As of May 22, 2026, DAVE (Dave Inc.) is in a choppy range state on the daily chart, with a confidence level of 62%. Key support is at $221 and key resistance at $232. Sharp run to ~$280 then pullback; price ~$228.46 sitting below EMA20/EMA50 but still above EMA100/SMA200 cluster, RSI ~42 (cooling).
Range resolution to the upside: price bases above the $220–$226 MA shelf, reclaims EMA50, then pushes into the prior breakdown zone; Elliott view: pullback as Wave 4 / (B) ending, setting up a Wave 5 / (C) attempt; Fib: reclaim of ~38.2–50% of the pullback favors continuation.
Deeper mean-reversion: failure to reclaim EMA50 leads to breakdown through EMA100/SMA100 and a test of the bigger MA base; Elliott view: pullback is an A-B-C with C extending; Fib: 61.8% pullback area becomes magnet.
2+ daily closes back above $232 (EMA50) with a higher low holding above $226 (SMA50).
Daily close below $205 (EMA200) would shift bias to a clearer DOWNTREND/FALLING_KNIFE risk.
Start near EMA100/SMA100 support ($220 area), add into EMA200/SMA200 confluence ($205–$212), heavy add only on flush into prior demand/pivot zone ~$195–$202 with tight risk rules.
Trim into prior supply and extension zones: first into $260–$270, more into the prior peak area $280–$295, and close if a momentum spike extends well beyond the prior high into ~$310+ (parabolic/overextension risk).
As of May 22, 2026, DAVE (Dave Inc.) is in a choppy range state on the daily chart with 62% confidence. Sharp run to ~$280 then pullback; price ~$228.46 sitting below EMA20/EMA50 but still above EMA100/SMA200 cluster, RSI ~42 (cooling).
On the daily timeframe, DAVE has key support at $221 and key resistance at $232. The most likely scenario (bullish) targets $243 and $260, with a revert level at $227.
DAVE (Dave Inc.) is currently classified as choppy range on the daily chart, with 62% confidence. Confirmation requires: 2+ daily closes back above $232 (EMA50) with a higher low holding above $226 (SMA50). This would be invalidated by: Daily close below $205 (EMA200) would shift bias to a clearer DOWNTREND/FALLING_KNIFE risk.
The most likely scenario (bullish) targets $243 and $260, with a revert level at $227. The alternative scenario (bearish) targets $212 and $200.
Multi-layer AI agents analyse 200+ stocks across daily, weekly, and monthly timeframes — producing market state classifications, price scenarios with targets, and position entry/exit levels. Daily charts updated every trading day at 6 PM ET. Weekly charts refresh Fridays. Monthly charts refresh on the last trading day of each month. No paywall. No sign-up required.
Built by Foliotrail.
All content on this website — including charts, analysis, price targets, support/resistance levels, and position zones — is generated entirely by AI and provided for educational and informational purposes only.
This is not financial advice. NEXUSNOIR VENTURES SL (the operator of this website) is not a registered investment adviser or broker-dealer. You should not make investment decisions based solely on this information. Always do your own research and consult a qualified financial advisor.
By continuing, you acknowledge that you have read and agree to our full disclaimer & terms of use and privacy policy.