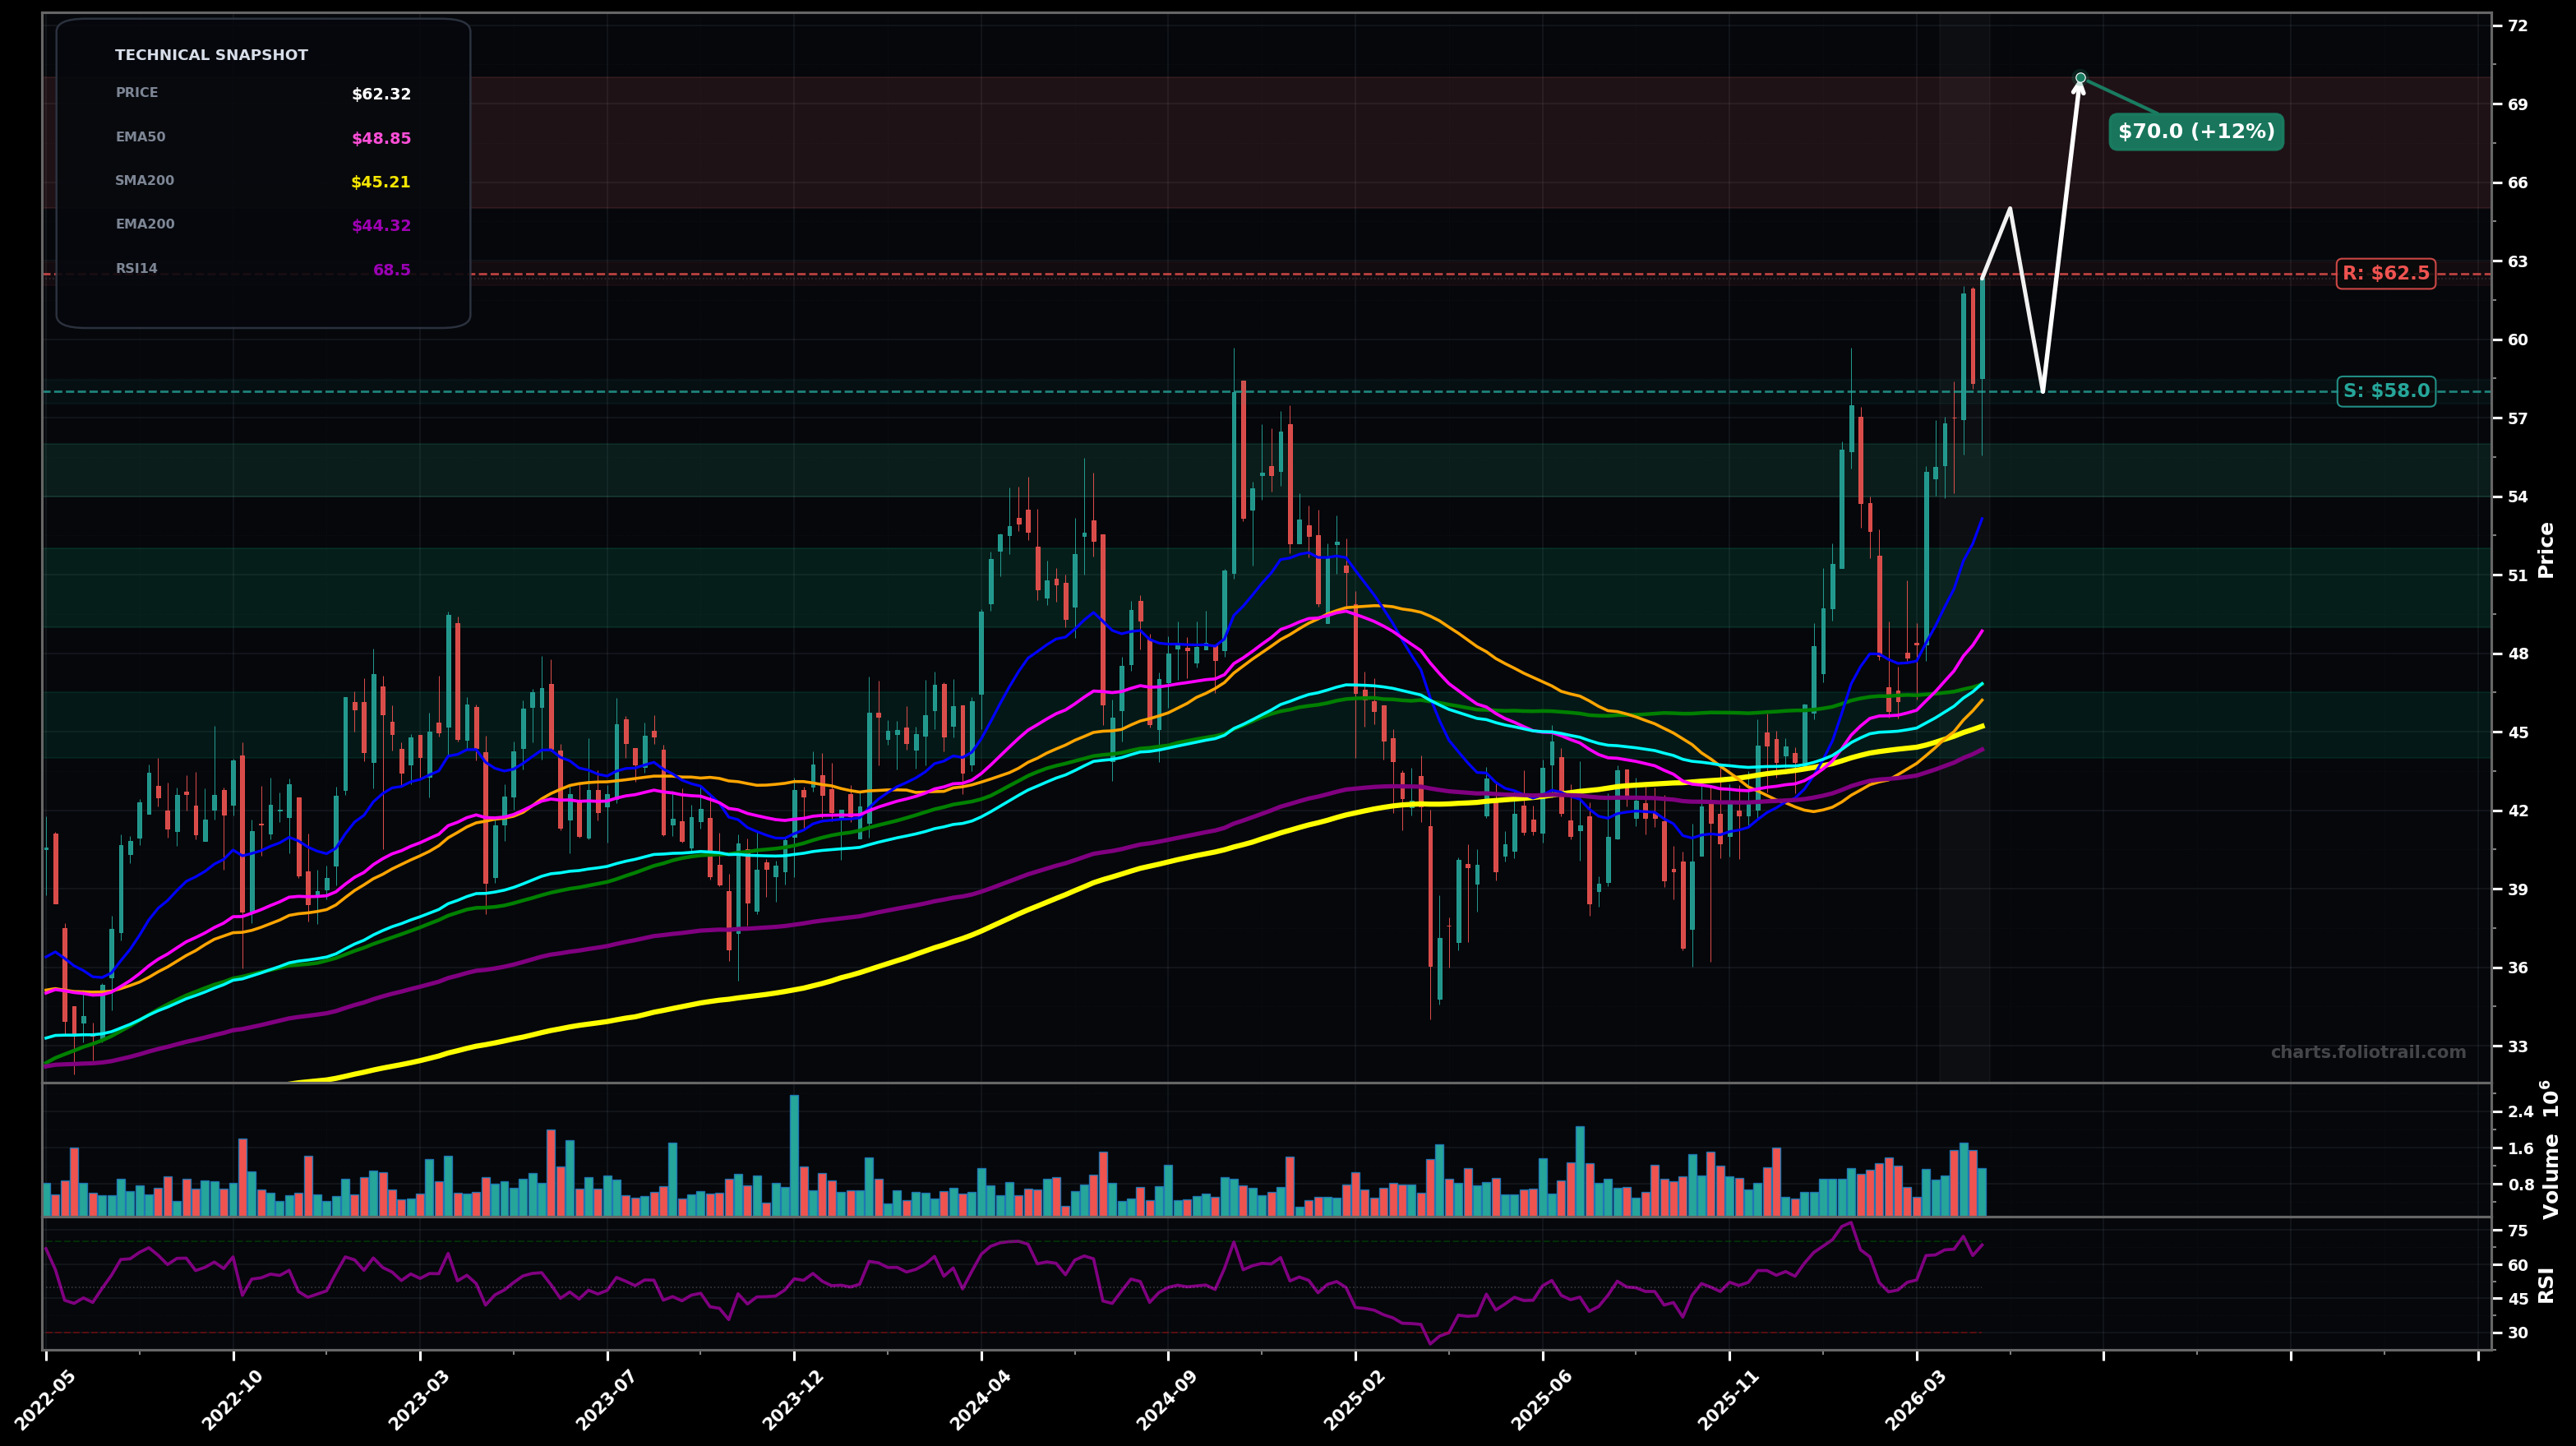
As of May 22, 2026, CTS (Cts Corporation) is in a parabolic state on the weekly chart, with a confidence level of 72%. Key support is at $58.0 and key resistance at $62.5. Strong impulsive weekly breakout to new swing highs (~$62) with follow-through; price extended well above all key MAs, RSI elevated (~68).
Bullish continuation with brief consolidation (flag/coil) above the breakout zone, then another push higher; wave-wise this looks like a late Wave 3 / early Wave 5 type extension risk but can still grind up before a larger Wave 4 pullback.
Mean-reversion pullback after the parabolic push (profit-taking); price retests the prior breakout and/or EMA20 area before attempting to resume uptrend—Elliott-wise a Wave 4-style correction toward key Fib retraces of the latest impulse (typical 23.6%–38.2%).
Weekly closes holding above ~$58.00
Weekly close below ~$52.50 (loses breakout base + first major higher low area)
Buy-the-dip framework: first entry on breakout retest/support ($54–$56), add near deeper Fib/structure & MA cluster ($49–$52), heavy add only near major trend MAs (EMA200/SMA200 region ~$44–$46.5).
Trim into strength as price becomes increasingly stretched above EMA50/EMA100 and into round-number/extension zones; heavier trims if price overshoots without base-building, full exit only on extreme multi-year extension.
As of May 22, 2026, CTS (Cts Corporation) is in a parabolic state on the weekly chart with 72% confidence. Strong impulsive weekly breakout to new swing highs (~$62) with follow-through; price extended well above all key MAs, RSI elevated (~68).
On the weekly timeframe, CTS has key support at $58.0 and key resistance at $62.5. The most likely scenario (bullish) targets $65.0 and $70.0, with a revert level at $58.0.
CTS (Cts Corporation) is currently classified as parabolic on the weekly chart, with 72% confidence. Confirmation requires: Weekly closes holding above ~$58.00 This would be invalidated by: Weekly close below ~$52.50 (loses breakout base + first major higher low area)
The most likely scenario (bullish) targets $65.0 and $70.0, with a revert level at $58.0. The alternative scenario (bearish) targets $54.5 and $49.0.
Multi-layer AI agents analyse 200+ stocks across daily, weekly, and monthly timeframes — producing market state classifications, price scenarios with targets, and position entry/exit levels. Daily charts updated every trading day at 6 PM ET. Weekly charts refresh Fridays. Monthly charts refresh on the last trading day of each month. No paywall. No sign-up required.
Built by Foliotrail.
All content on this website — including charts, analysis, price targets, support/resistance levels, and position zones — is generated entirely by AI and provided for educational and informational purposes only.
This is not financial advice. NEXUSNOIR VENTURES SL (the operator of this website) is not a registered investment adviser or broker-dealer. You should not make investment decisions based solely on this information. Always do your own research and consult a qualified financial advisor.
By continuing, you acknowledge that you have read and agree to our full disclaimer & terms of use and privacy policy.