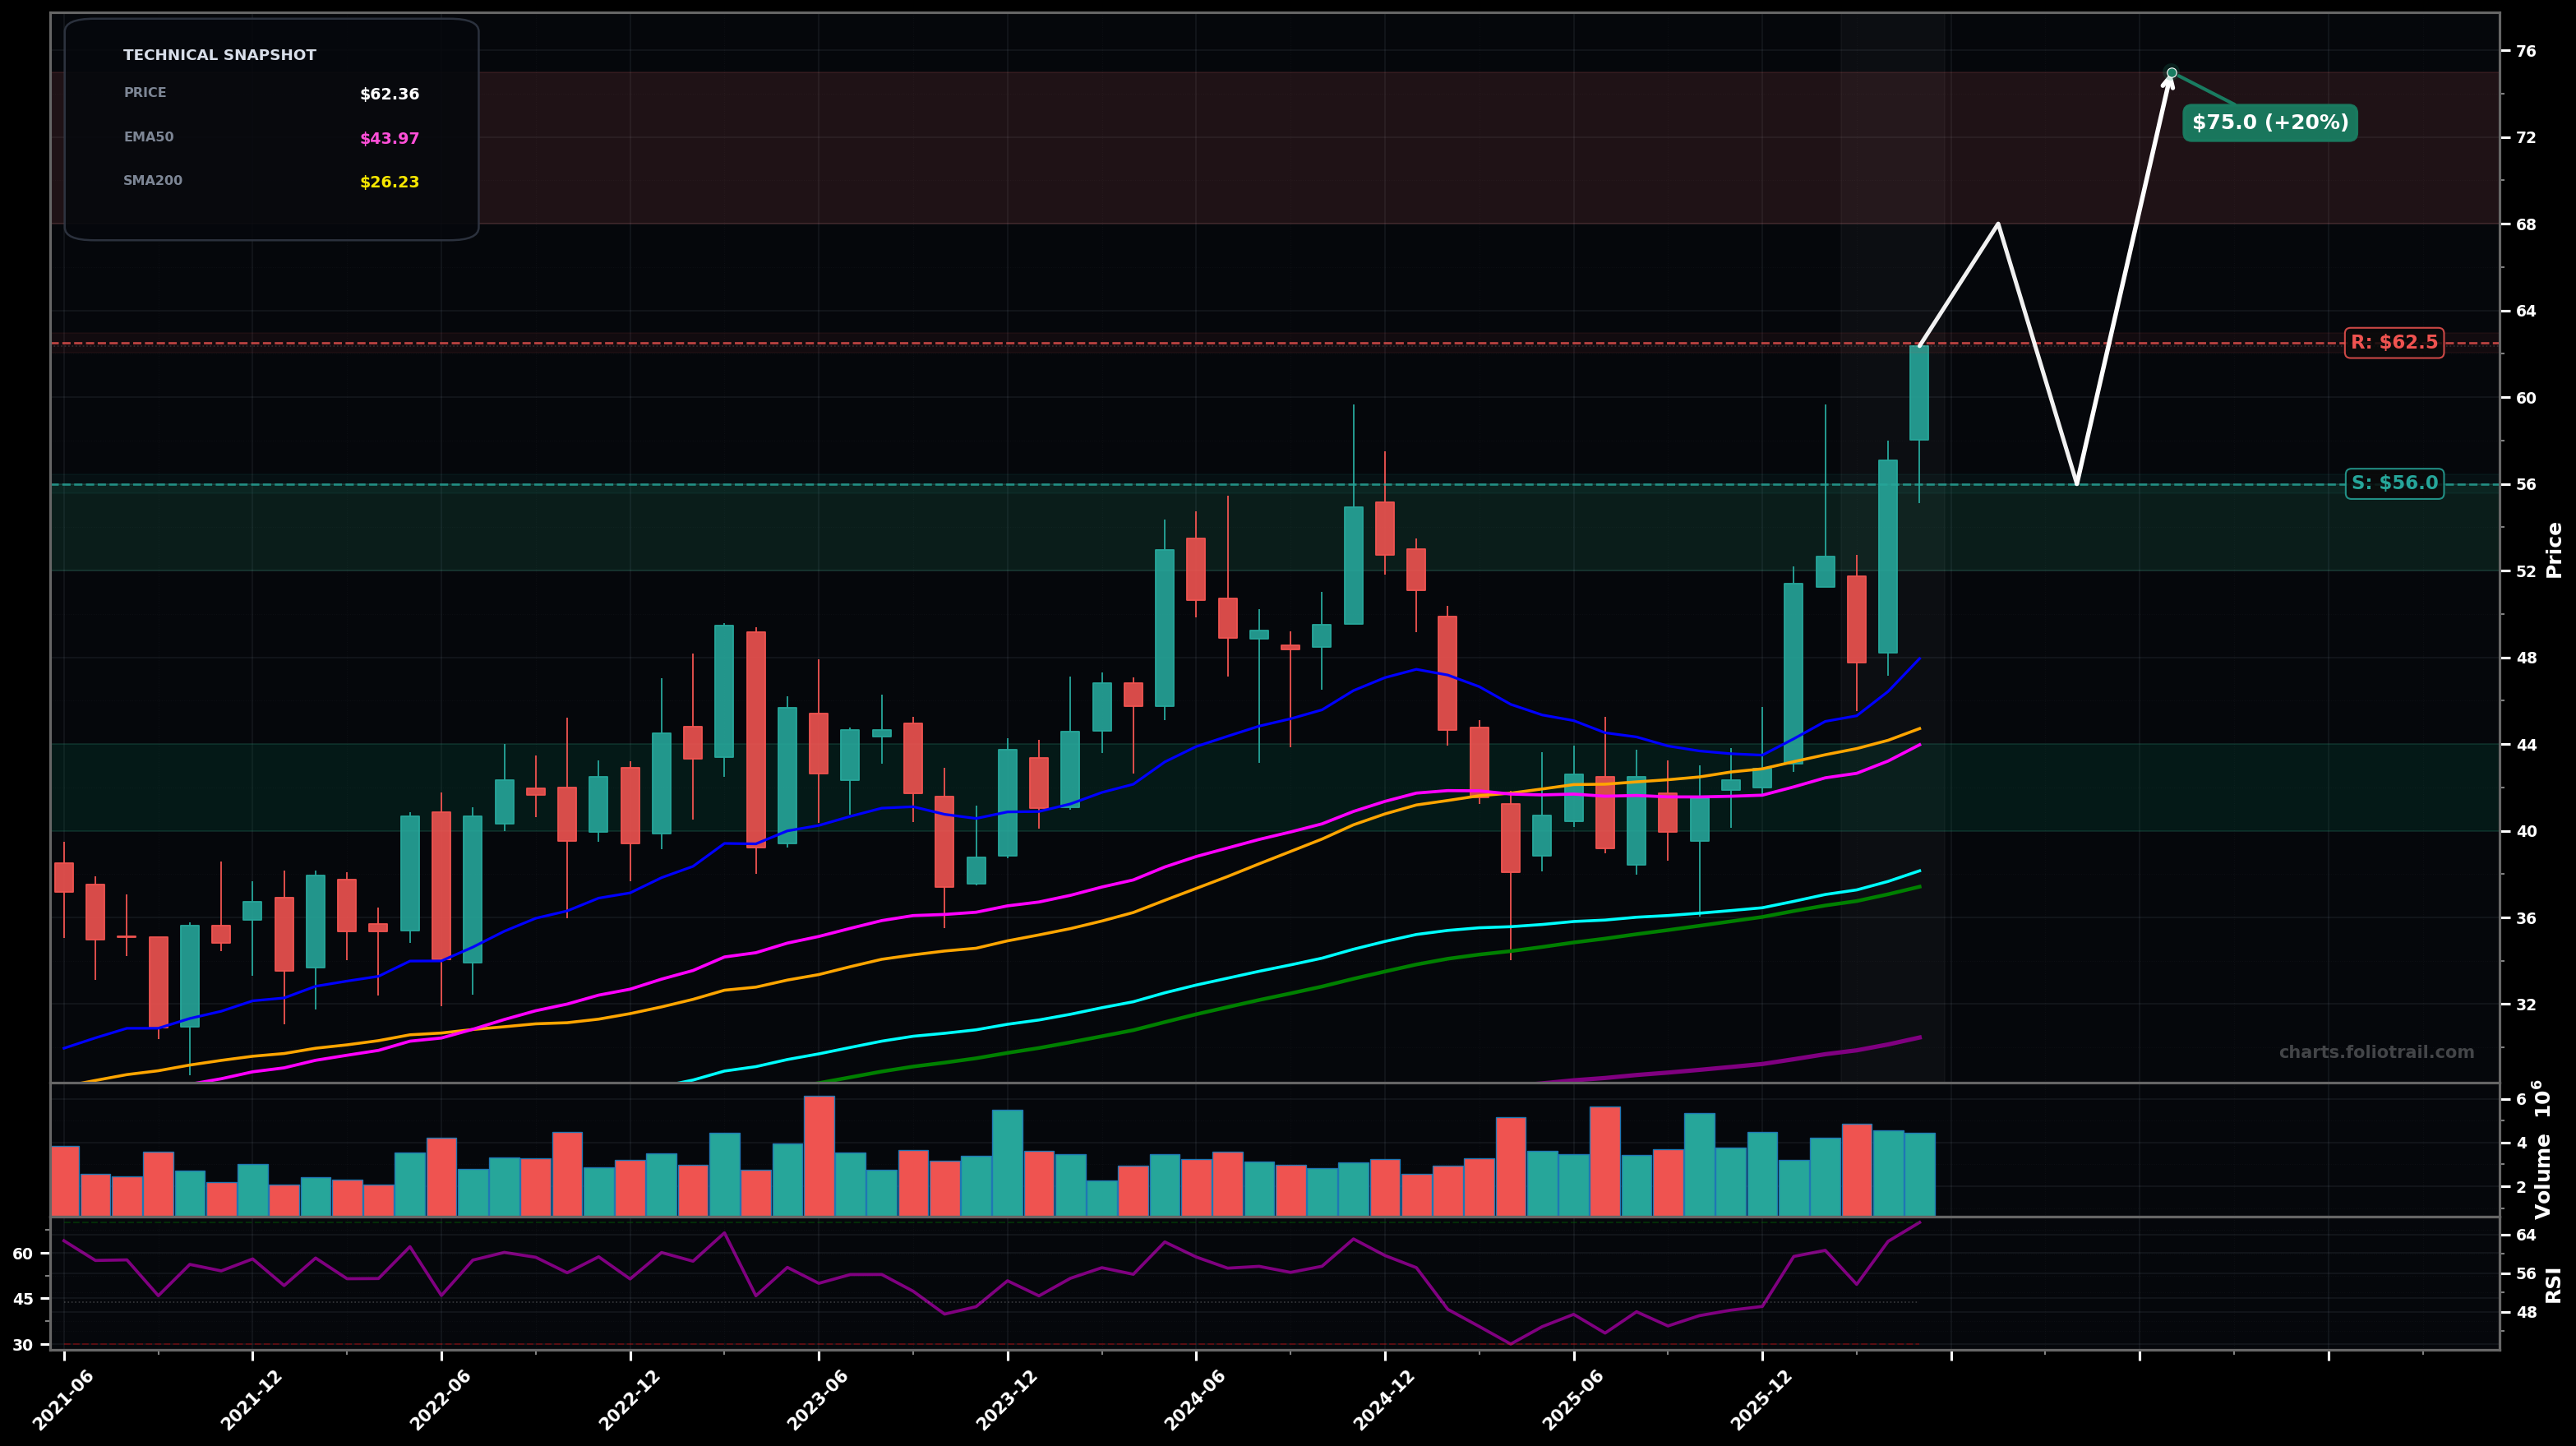
As of May 22, 2026, CTS (Cts Corporation) is in a uptrend state on the monthly chart, with a confidence level of 72%. Key support is at $56.0 and key resistance at $62.5. Strong monthly breakout to new swing highs; price ~$62.36 well above EMA50/EMA100 with RSI(14) ~66 (momentum strong but not extreme).
Bullish continuation: breakout consolidates above ~$56 then trends toward the next Fibonacci extensions; wave structure looks like an impulsive advance (likely Elliott wave 3/5 phase) with a shallow wave-4-type pullback risk.
Bearish deviation: failed breakout / bull trap—price loses ~$56 and mean-reverts toward the rising EMA50/SMA50 zone; would fit a deeper wave-4 correction before another attempt higher.
Monthly close holding above $56.00 (prior breakout level) for 2+ months
Monthly close below $43.97 (EMA50) would shift to range/early breakdown risk
Buy-the-dip plan uses the breakout retest (~$56) then prior congestion/round-number supports; deeper adds align with SMA50/EMA50 area (~$44) and the lower base if breakout fails.
Trim into extension zones above the breakout where price would likely be stretched vs EMA50/100 and prone to multi-month mean reversion; larger trims/exit reserved for clear long-term overextension blow-off behavior.
As of May 22, 2026, CTS (Cts Corporation) is in a uptrend state on the monthly chart with 72% confidence. Strong monthly breakout to new swing highs; price ~$62.36 well above EMA50/EMA100 with RSI(14) ~66 (momentum strong but not extreme).
On the monthly timeframe, CTS has key support at $56.0 and key resistance at $62.5. The most likely scenario (bullish) targets $68.0 and $75.0, with a revert level at $56.0.
CTS (Cts Corporation) is currently classified as uptrend on the monthly chart, with 72% confidence. Confirmation requires: Monthly close holding above $56.00 (prior breakout level) for 2+ months This would be invalidated by: Monthly close below $43.97 (EMA50) would shift to range/early breakdown risk
The most likely scenario (bullish) targets $68.0 and $75.0, with a revert level at $56.0. The alternative scenario (bearish) targets $50.0 and $44.0.
Multi-layer AI agents analyse 200+ stocks across daily, weekly, and monthly timeframes — producing market state classifications, price scenarios with targets, and position entry/exit levels. Daily charts updated every trading day at 6 PM ET. Weekly charts refresh Fridays. Monthly charts refresh on the last trading day of each month. No paywall. No sign-up required.
Built by Foliotrail.
All content on this website — including charts, analysis, price targets, support/resistance levels, and position zones — is generated entirely by AI and provided for educational and informational purposes only.
This is not financial advice. NEXUSNOIR VENTURES SL (the operator of this website) is not a registered investment adviser or broker-dealer. You should not make investment decisions based solely on this information. Always do your own research and consult a qualified financial advisor.
By continuing, you acknowledge that you have read and agree to our full disclaimer & terms of use and privacy policy.