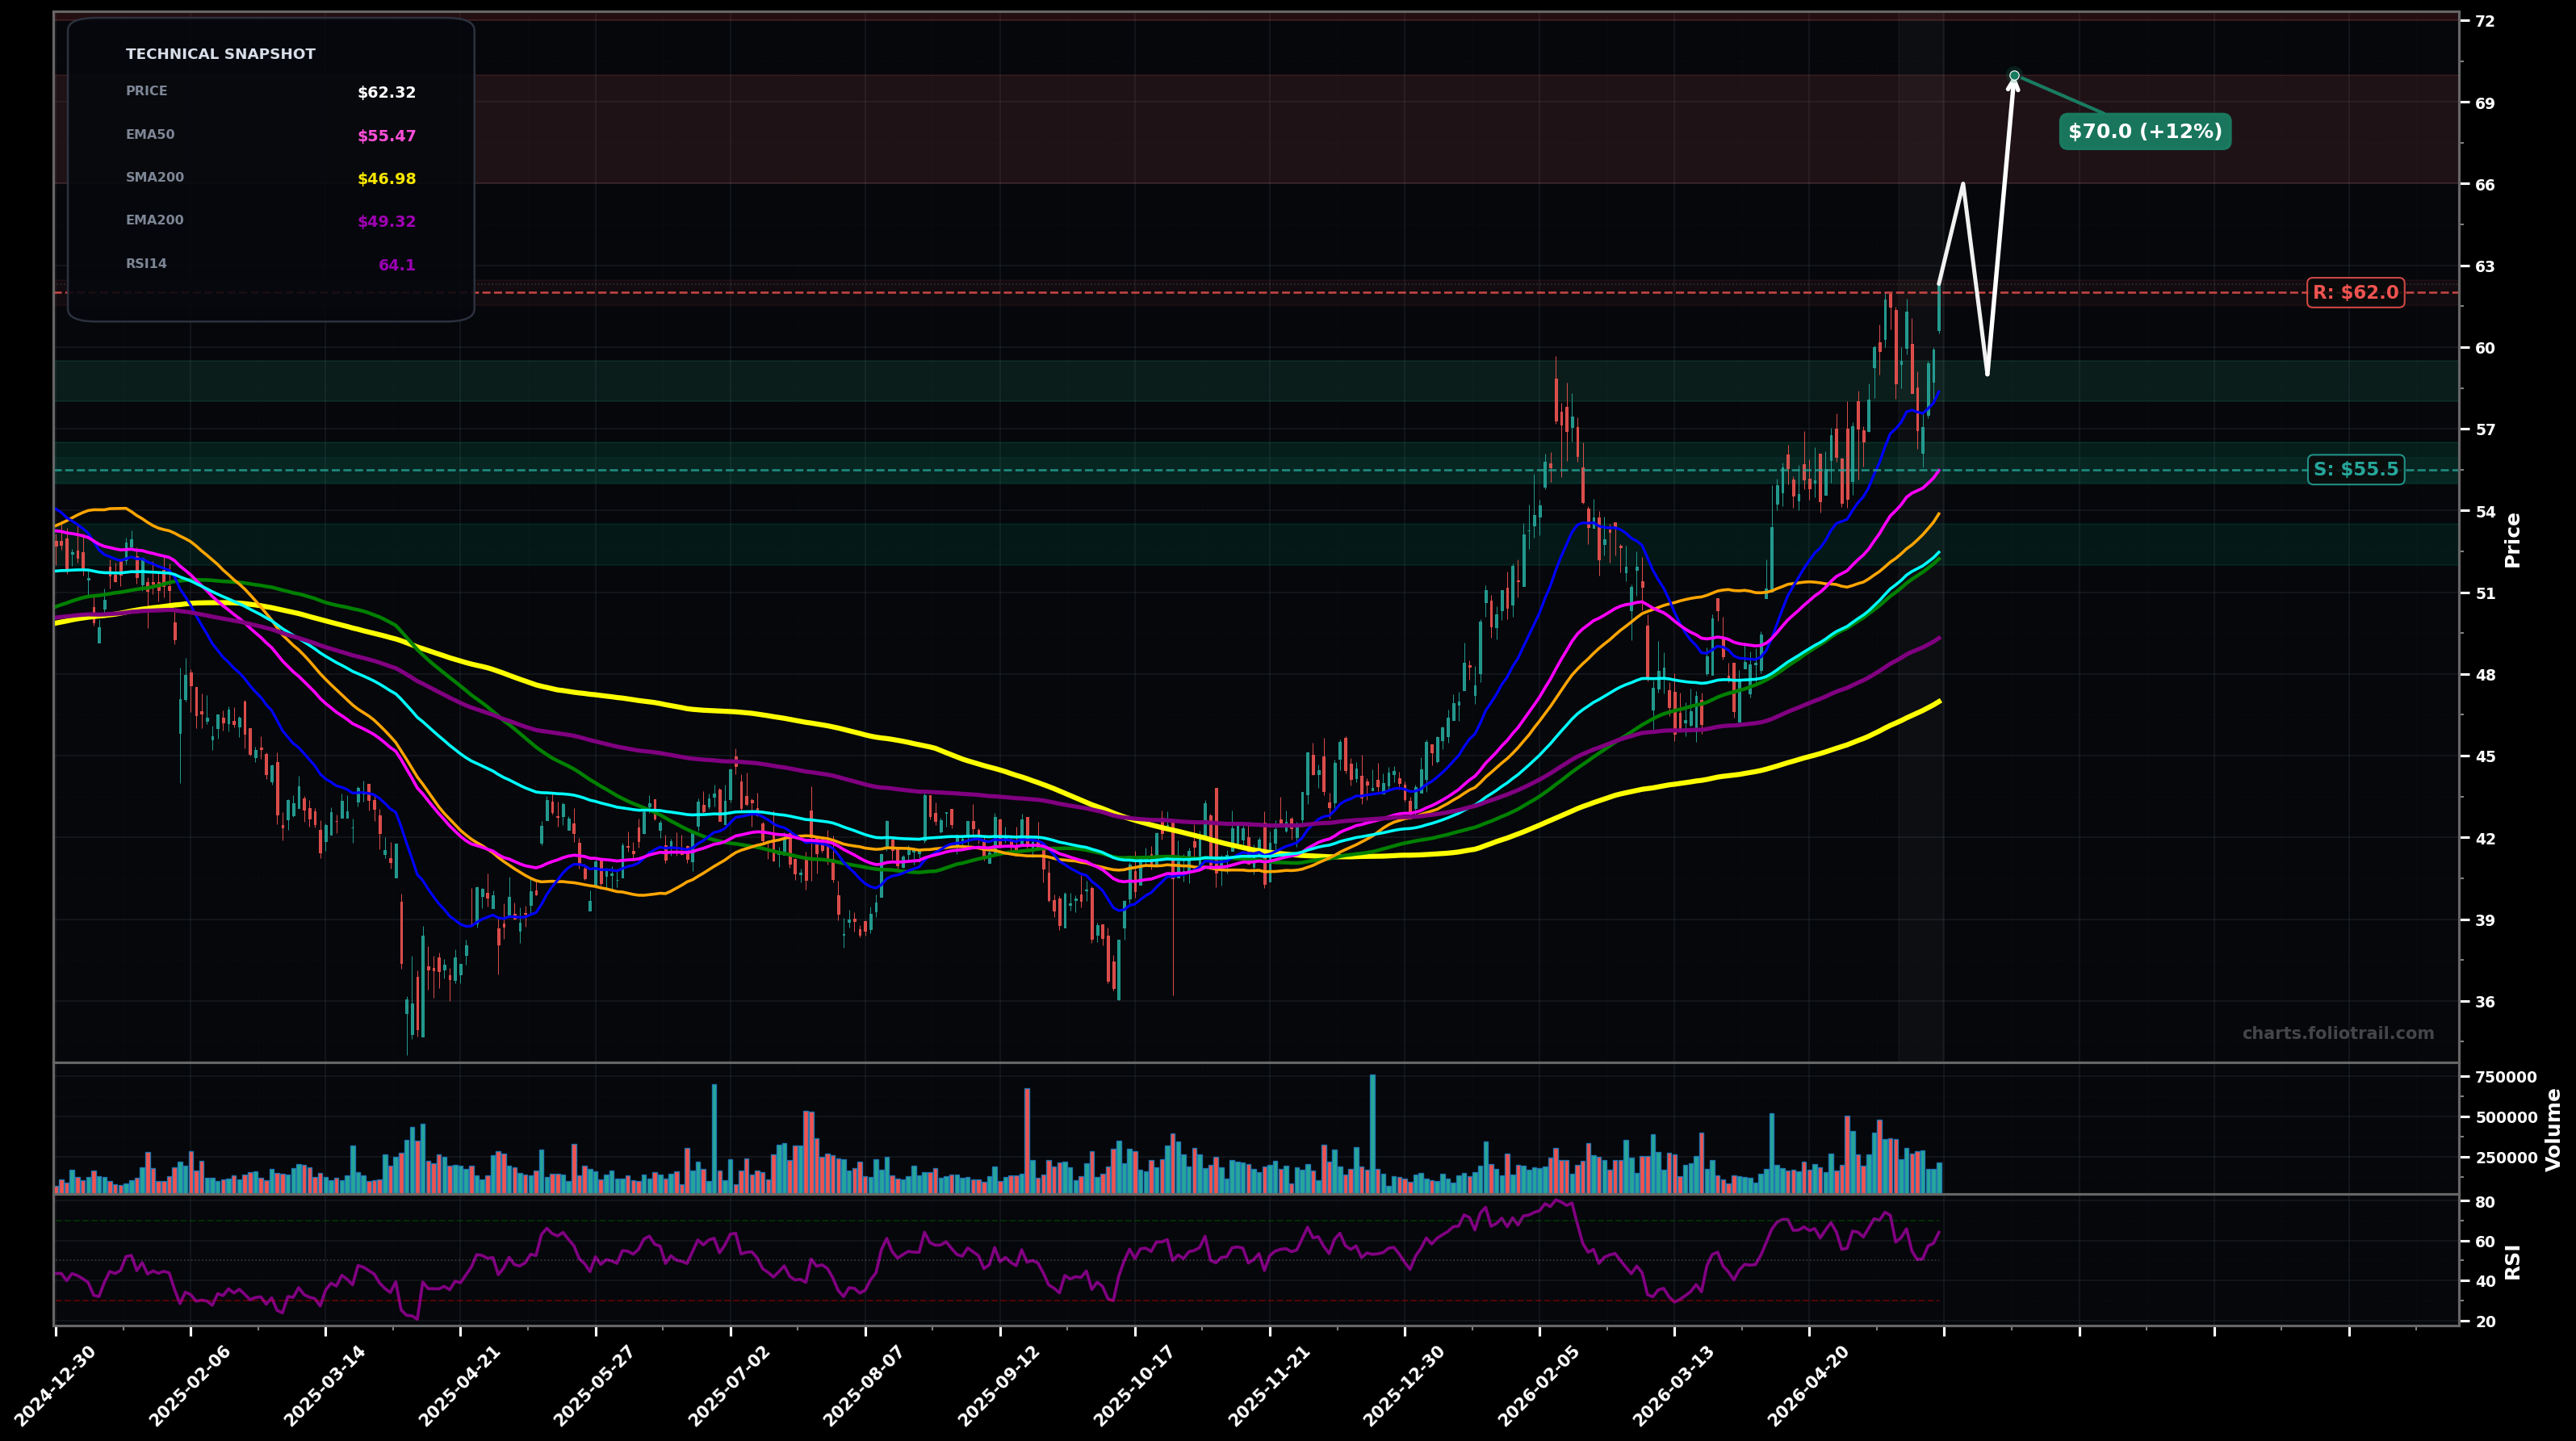
As of May 22, 2026, CTS (Cts Corporation) is in a uptrend state on the daily chart, with a confidence level of 72%. Key support is at $55.5 and key resistance at $62.0. Price at $62.32 pushed back to prior highs after a sharp pullback to ~$55–$56; holding well above EMA50/EMA100 with RSI ~64 (momentum positive).
Bullish continuation: breakout/hold above the $62 prior-high area, then extension higher as the uptrend resumes (likely Wave 5 continuation or Wave 3 extension depending on count).
Bearish pullback within uptrend: rejection near $62 leads to mean reversion toward EMA50/cluster support; trend remains intact unless $55 breaks (possible Wave 4-type correction).
2+ daily closes above $62.00 (clean breakout/hold of the prior high zone).
Daily close below $55.00 (loss of EMA50 area and last breakout support).
Start on shallow pullback (former breakout/structure), add at EMA50 support, heavy add near EMA100/SMA100 confluence where prior trend should be defended.
Trim into upside extensions above prior ATH zone and likely fib extensions; progressively reduce as price stretches far above EMA50/EMA100 where mean-reversion risk rises.
As of May 22, 2026, CTS (Cts Corporation) is in a uptrend state on the daily chart with 72% confidence. Price at $62.32 pushed back to prior highs after a sharp pullback to ~$55–$56; holding well above EMA50/EMA100 with RSI ~64 (momentum positive).
On the daily timeframe, CTS has key support at $55.5 and key resistance at $62.0. The most likely scenario (bullish) targets $66.0 and $70.0, with a revert level at $59.0.
CTS (Cts Corporation) is currently classified as uptrend on the daily chart, with 72% confidence. Confirmation requires: 2+ daily closes above $62.00 (clean breakout/hold of the prior high zone). This would be invalidated by: Daily close below $55.00 (loss of EMA50 area and last breakout support).
The most likely scenario (bullish) targets $66.0 and $70.0, with a revert level at $59.0. The alternative scenario (bearish) targets $58.3 and $55.5.
Multi-layer AI agents analyse 200+ stocks across daily, weekly, and monthly timeframes — producing market state classifications, price scenarios with targets, and position entry/exit levels. Daily charts updated every trading day at 6 PM ET. Weekly charts refresh Fridays. Monthly charts refresh on the last trading day of each month. No paywall. No sign-up required.
Built by Foliotrail.
All content on this website — including charts, analysis, price targets, support/resistance levels, and position zones — is generated entirely by AI and provided for educational and informational purposes only.
This is not financial advice. NEXUSNOIR VENTURES SL (the operator of this website) is not a registered investment adviser or broker-dealer. You should not make investment decisions based solely on this information. Always do your own research and consult a qualified financial advisor.
By continuing, you acknowledge that you have read and agree to our full disclaimer & terms of use and privacy policy.