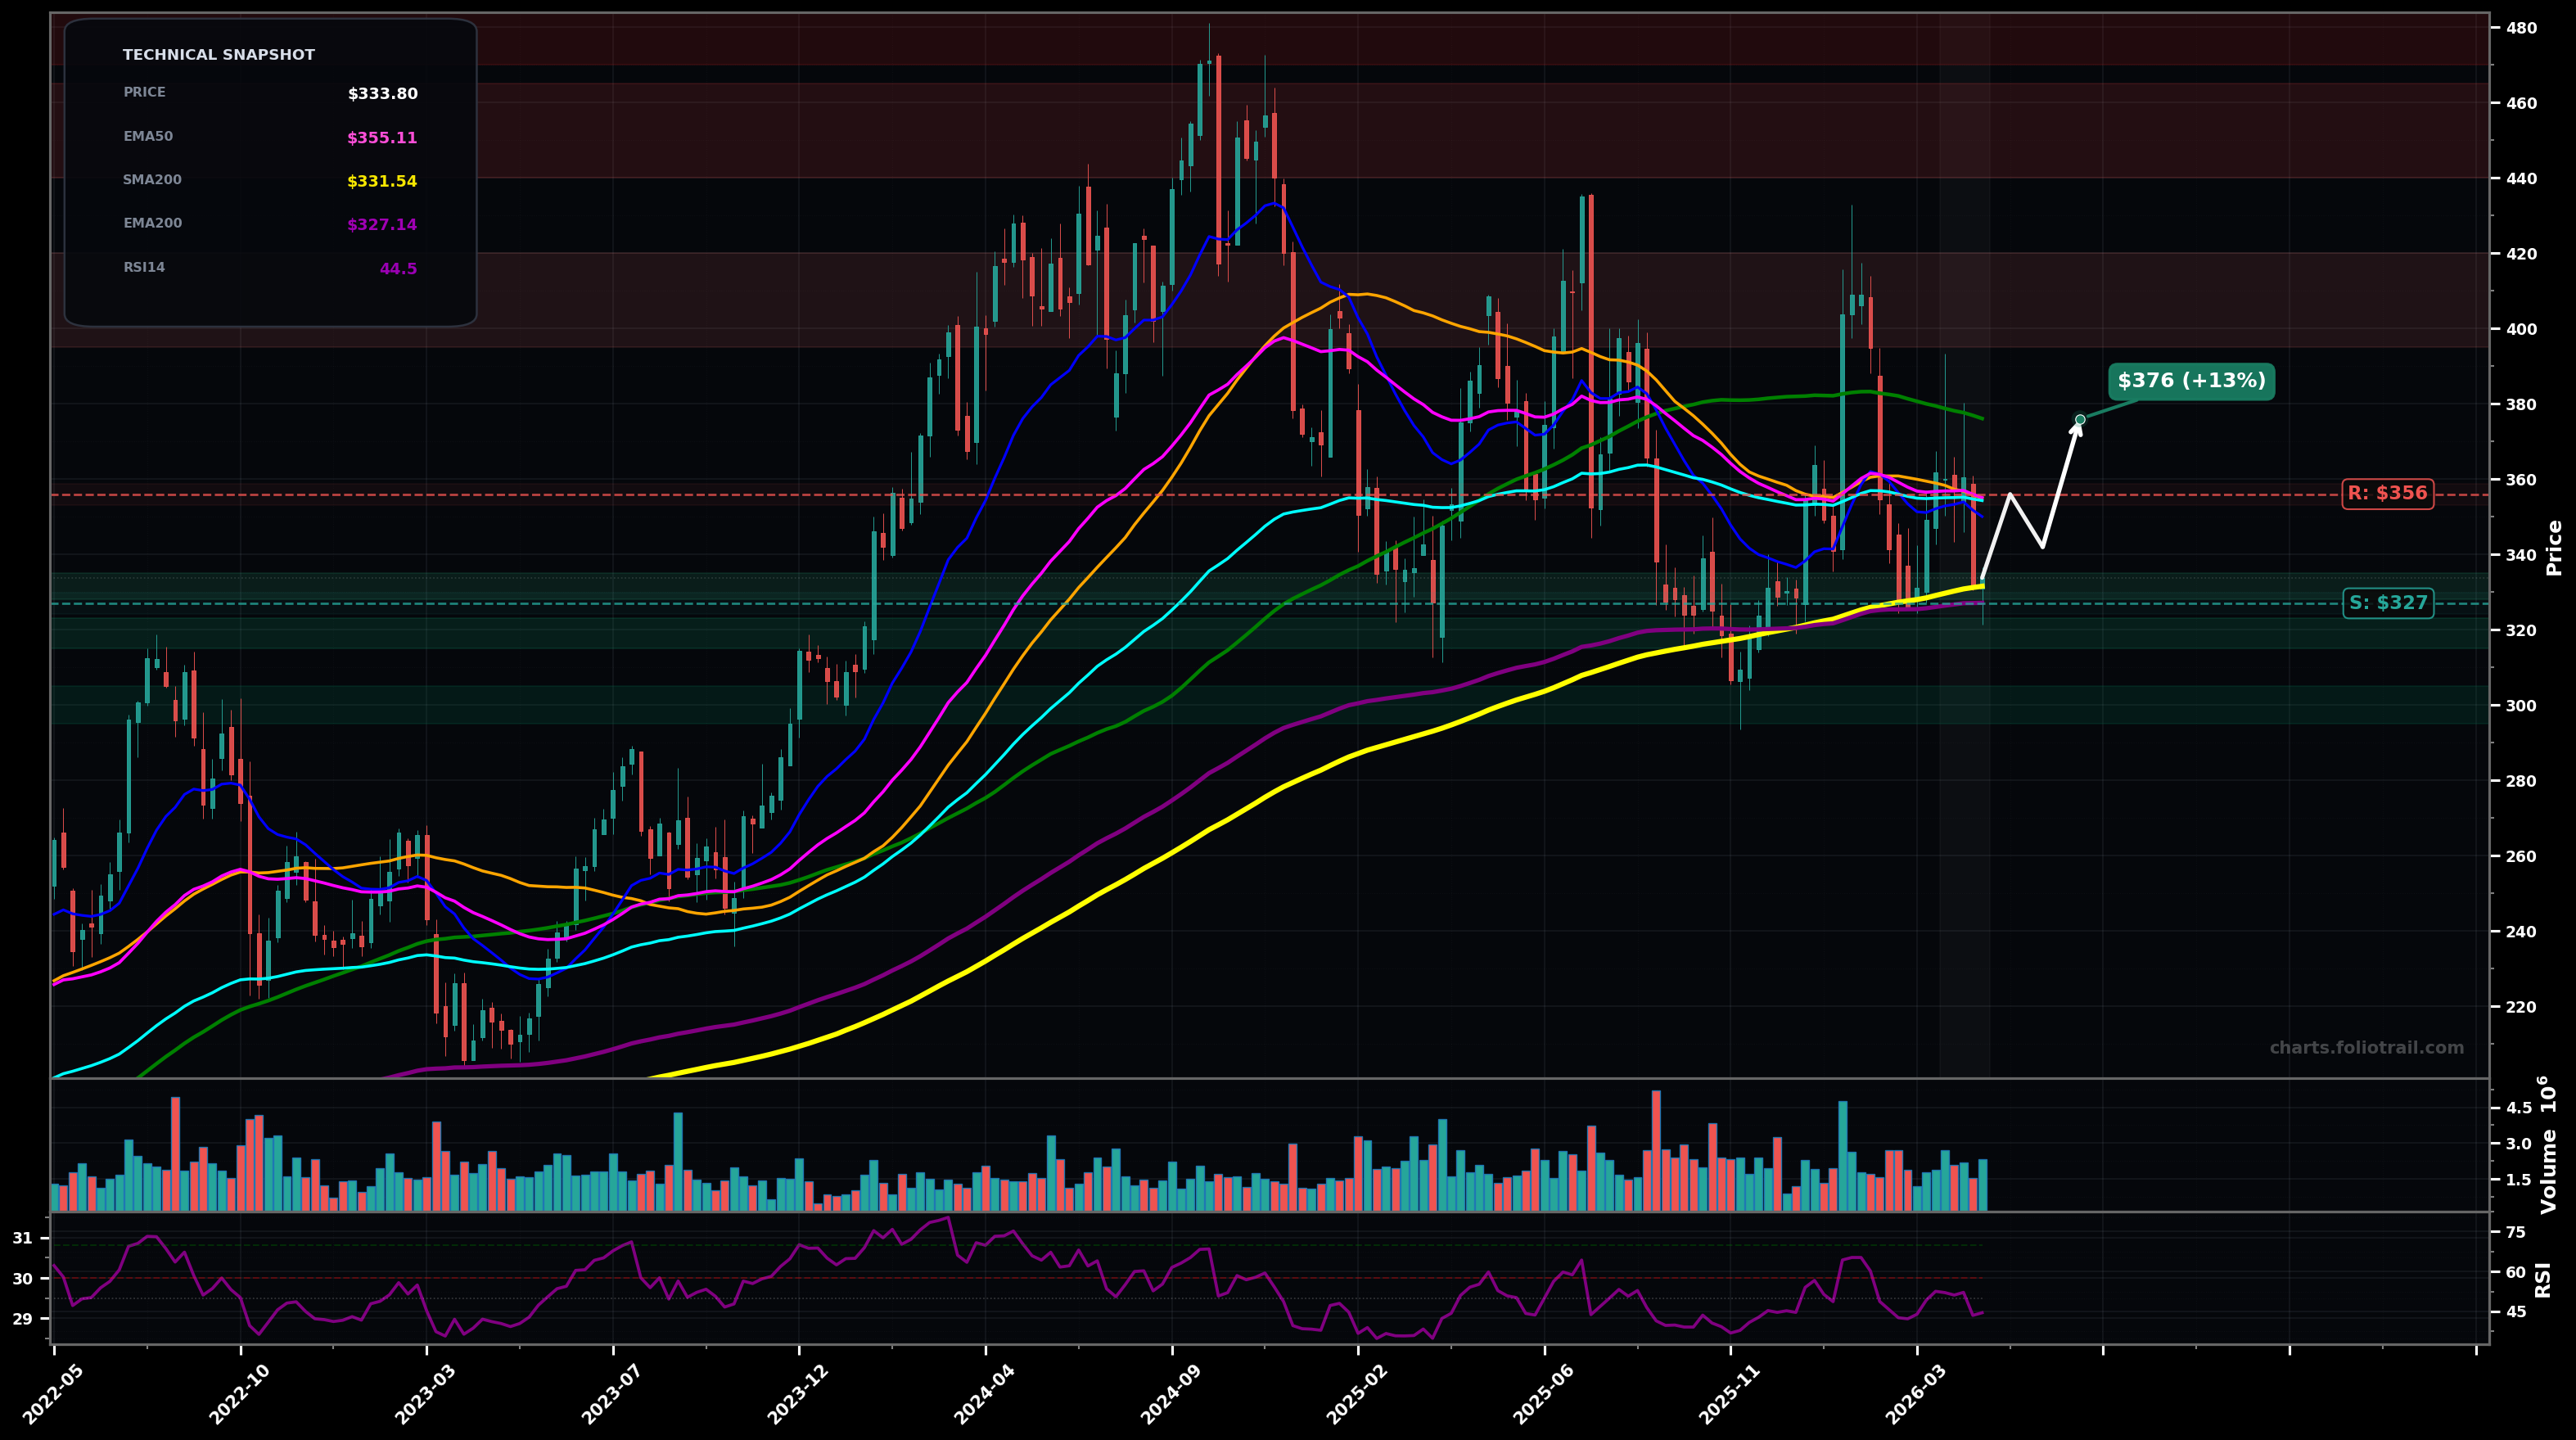
As of May 22, 2026, CSL (Carlisle Companies Inc.) is in a choppy range state on the weekly chart, with a confidence level of 63%. Key support is at $327 and key resistance at $356. Weekly price rejected the $350–$360 MA cluster and pulled back to ~$334, now sitting just above rising long-term MAs (EMA200/SMA200).
Range continuation with a mild bearish bias: price holds the $327–$333 demand area (EMA200/SMA200 region), then mean-reverts back toward the $350–$356 MA cluster; only after acceptance above it does a push to the prior swing supply become likely. (prob ~60%)
Support failure: a break/close below the $327–$331 long-term MA shelf triggers a deeper leg down toward the next visible demand zone; any bounce likely retests ~$327 from below as resistance. (prob ~40%)
2 weekly closes holding above $356
Weekly close below $327
Entries staged around the swing low/high reference support shelf at EMA200/SMA200 (~$327–$331); add if breakdown retests lower demand; heavy add only at deeper capitulation support.
Trim into prior supply zones from the distribution band (failed rebounds) and the prior peak area; full exit if price revisits the old high region where rejection previously occurred.
As of May 22, 2026, CSL (Carlisle Companies Inc.) is in a choppy range state on the weekly chart with 63% confidence. Weekly price rejected the $350–$360 MA cluster and pulled back to ~$334, now sitting just above rising long-term MAs (EMA200/SMA200).
On the weekly timeframe, CSL has key support at $327 and key resistance at $356. The most likely scenario (bullish) targets $356 and $376, with a revert level at $342.
CSL (Carlisle Companies Inc.) is currently classified as choppy range on the weekly chart, with 63% confidence. Confirmation requires: 2 weekly closes holding above $356 This would be invalidated by: Weekly close below $327
The most likely scenario (bullish) targets $356 and $376, with a revert level at $342. The alternative scenario (bearish) targets $312 and $295.
Multi-layer AI agents analyse 200+ stocks across daily, weekly, and monthly timeframes — producing market state classifications, price scenarios with targets, and position entry/exit levels. Daily charts updated every trading day at 6 PM ET. Weekly charts refresh Fridays. Monthly charts refresh on the last trading day of each month. No paywall. No sign-up required.
Built by Foliotrail.
All content on this website — including charts, analysis, price targets, support/resistance levels, and position zones — is generated entirely by AI and provided for educational and informational purposes only.
This is not financial advice. NEXUSNOIR VENTURES SL (the operator of this website) is not a registered investment adviser or broker-dealer. You should not make investment decisions based solely on this information. Always do your own research and consult a qualified financial advisor.
By continuing, you acknowledge that you have read and agree to our full disclaimer & terms of use and privacy policy.