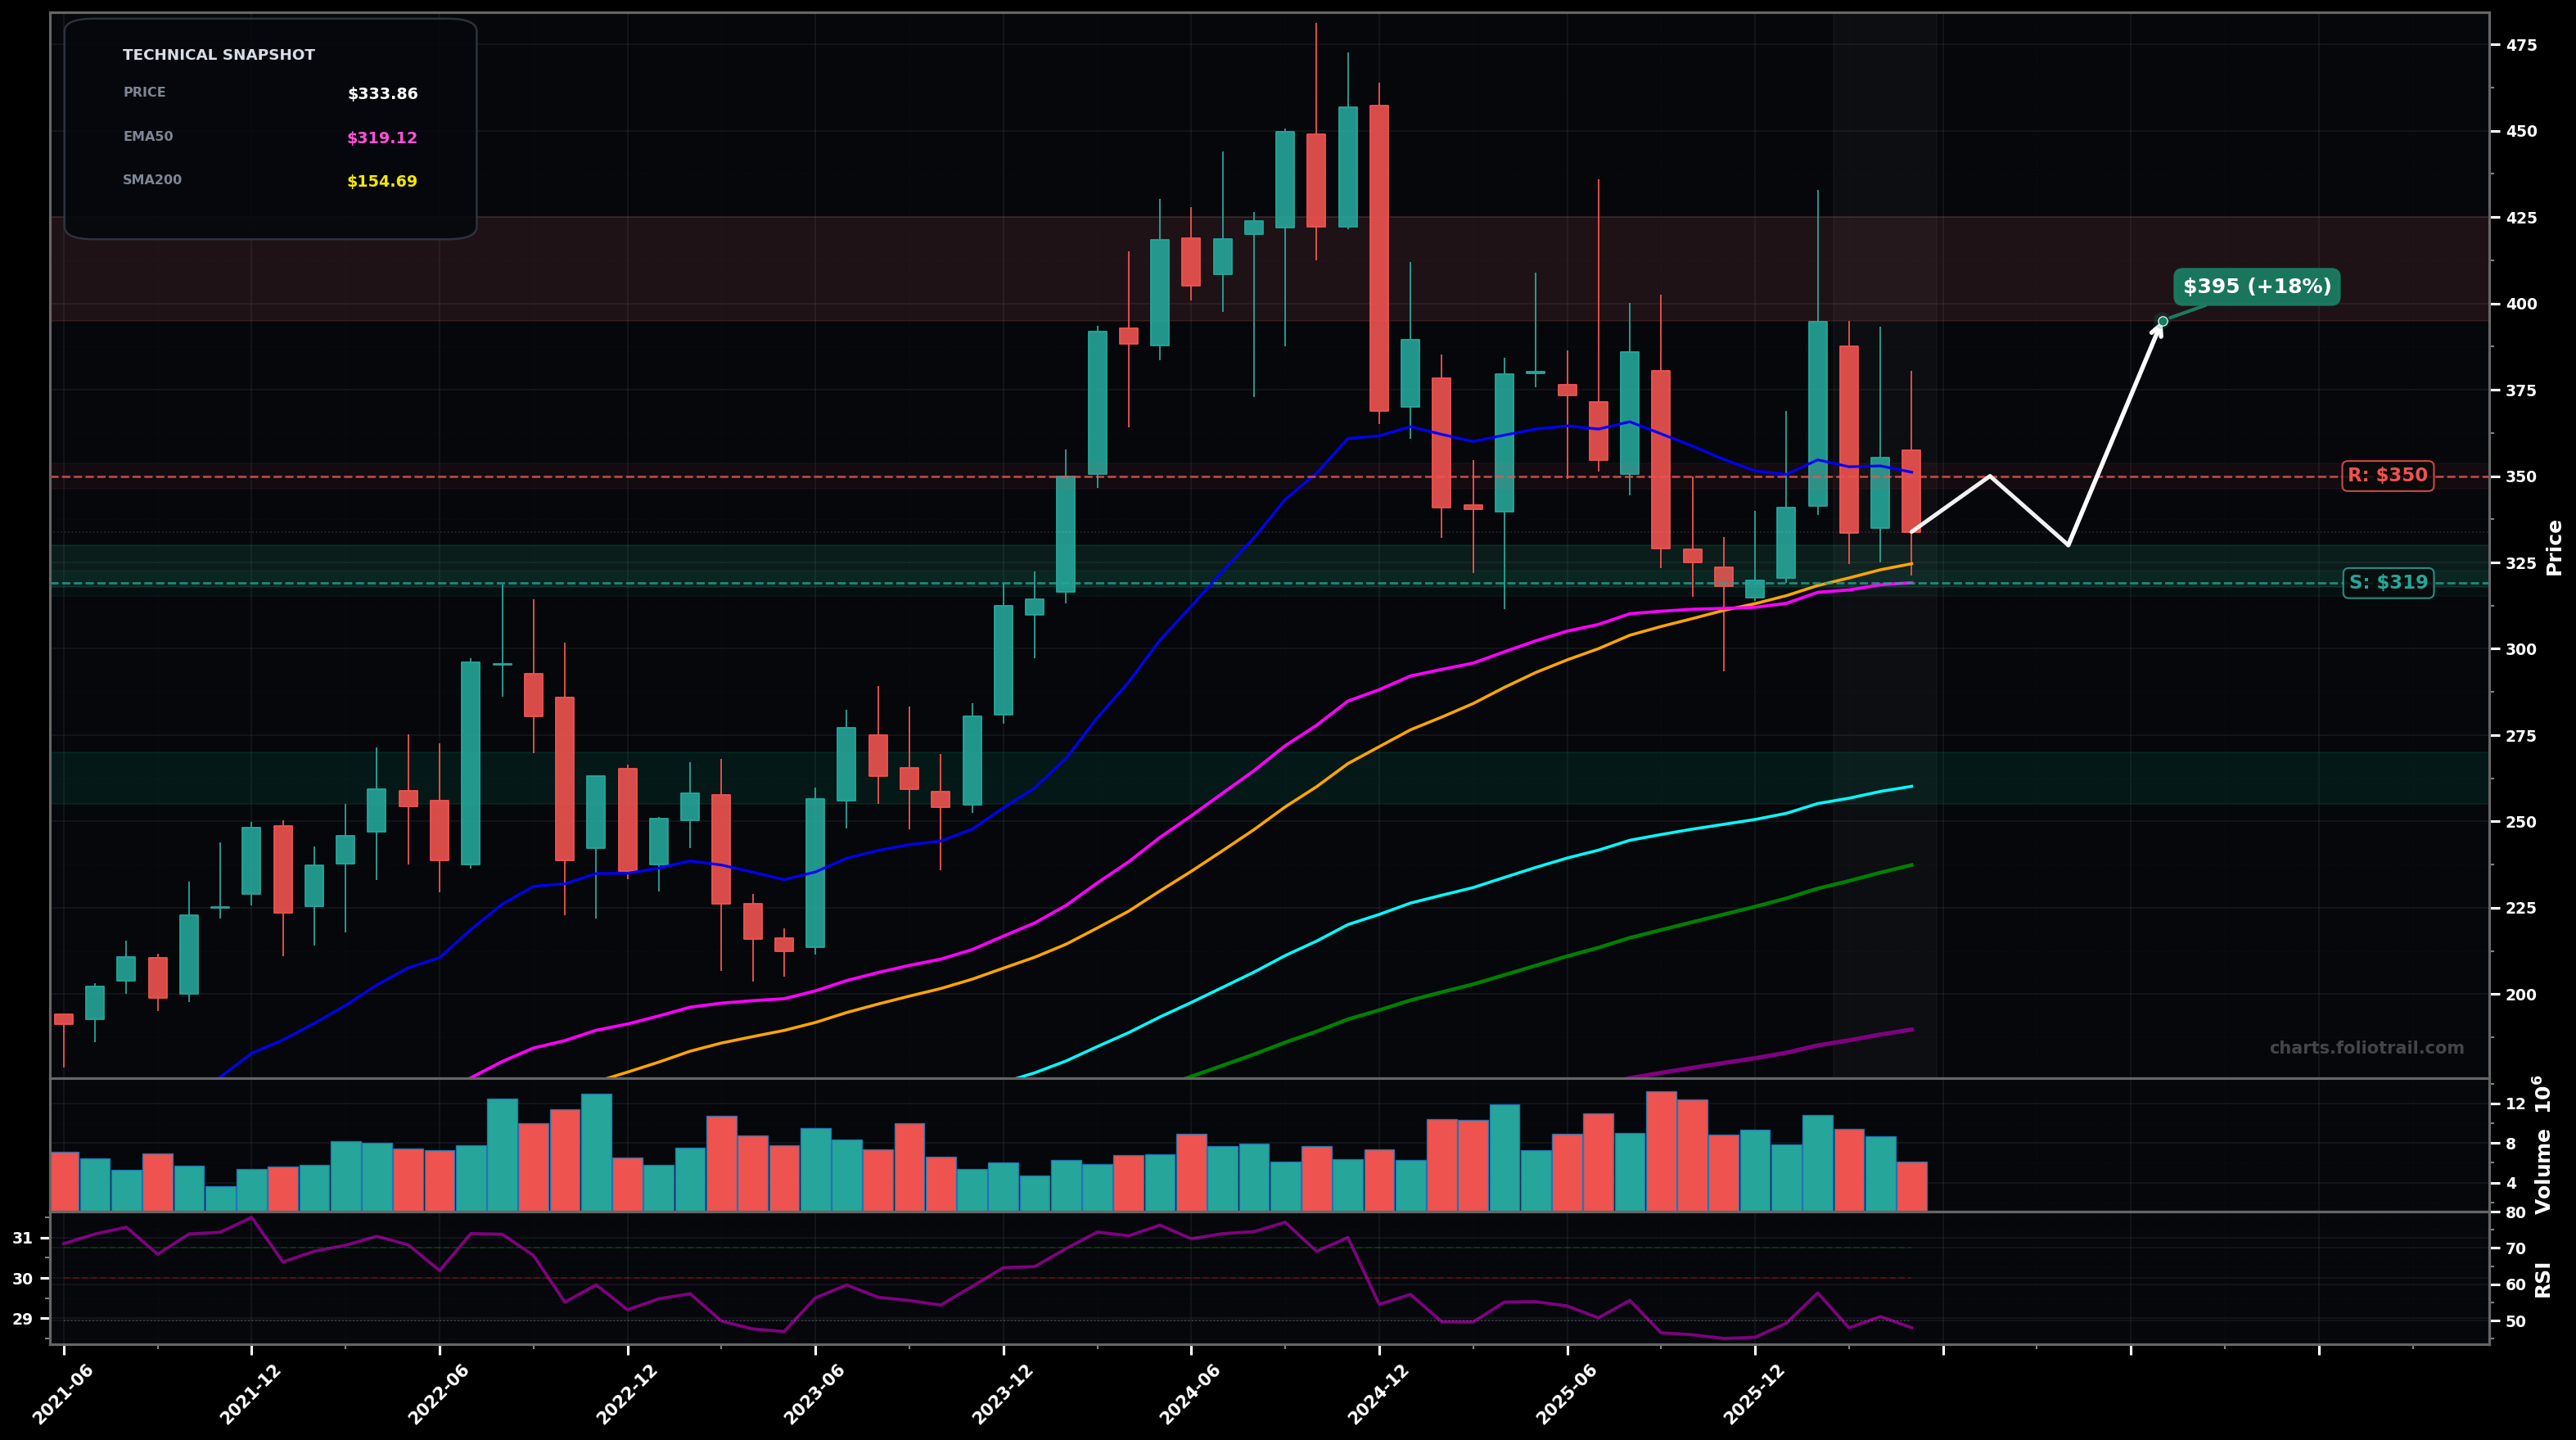
As of May 22, 2026, CSL (Carlisle Companies Inc.) is in a choppy range state on the monthly chart, with a confidence level of 62%. Key support is at $319 and key resistance at $350. Monthly pullback from prior peak (~$460) has drifted into the $320-$350 band; last close ~$333.86 is sitting just above EMA50 (~$319) and near SMA50 (~$324) with RSI ~48 (neutral).
Range continuation: price holds the $319-$324 MA cluster and grinds back toward the mid/upper range; a breakout attempt likely needs a clean reclaim of ~$350 then ~$370.
Range breaks down: a monthly close under the EMA50/SMA50 cluster turns this into a deeper correction toward the next demand shelf (prior consolidation / fib retrace area).
Confirm range if price holds above $319 (EMA50) for 2 monthly closes while failing again below $370-$380.
Invalidate range if a monthly close breaks and holds below $319 (EMA50) and then loses $300.
Start near EMA50/SMA50 confluence ($319-$325); add on clean loss/retest of $300; heavy add near EMA100 (~$260) where larger-trend support is more likely.
Trim into prior supply near ~$400+ and the former peak zone ~$450-$470; full close only on a strong multi-year extension above prior highs (measured-move/fib extension zone).
As of May 22, 2026, CSL (Carlisle Companies Inc.) is in a choppy range state on the monthly chart with 62% confidence. Monthly pullback from prior peak (~$460) has drifted into the $320-$350 band; last close ~$333.86 is sitting just above EMA50 (~$319) and near SMA50 (~$324) with RSI ~48 (neutral).
On the monthly timeframe, CSL has key support at $319 and key resistance at $350. The most likely scenario (bullish) targets $350 and $395, with a revert level at $330.
CSL (Carlisle Companies Inc.) is currently classified as choppy range on the monthly chart, with 62% confidence. Confirmation requires: Confirm range if price holds above $319 (EMA50) for 2 monthly closes while failing again below $370-$380. This would be invalidated by: Invalidate range if a monthly close breaks and holds below $319 (EMA50) and then loses $300.
The most likely scenario (bullish) targets $350 and $395, with a revert level at $330. The alternative scenario (bearish) targets $300 and $260.
Multi-layer AI agents analyse 200+ stocks across daily, weekly, and monthly timeframes — producing market state classifications, price scenarios with targets, and position entry/exit levels. Daily charts updated every trading day at 6 PM ET. Weekly charts refresh Fridays. Monthly charts refresh on the last trading day of each month. No paywall. No sign-up required.
Built by Foliotrail.
All content on this website — including charts, analysis, price targets, support/resistance levels, and position zones — is generated entirely by AI and provided for educational and informational purposes only.
This is not financial advice. NEXUSNOIR VENTURES SL (the operator of this website) is not a registered investment adviser or broker-dealer. You should not make investment decisions based solely on this information. Always do your own research and consult a qualified financial advisor.
By continuing, you acknowledge that you have read and agree to our full disclaimer & terms of use and privacy policy.