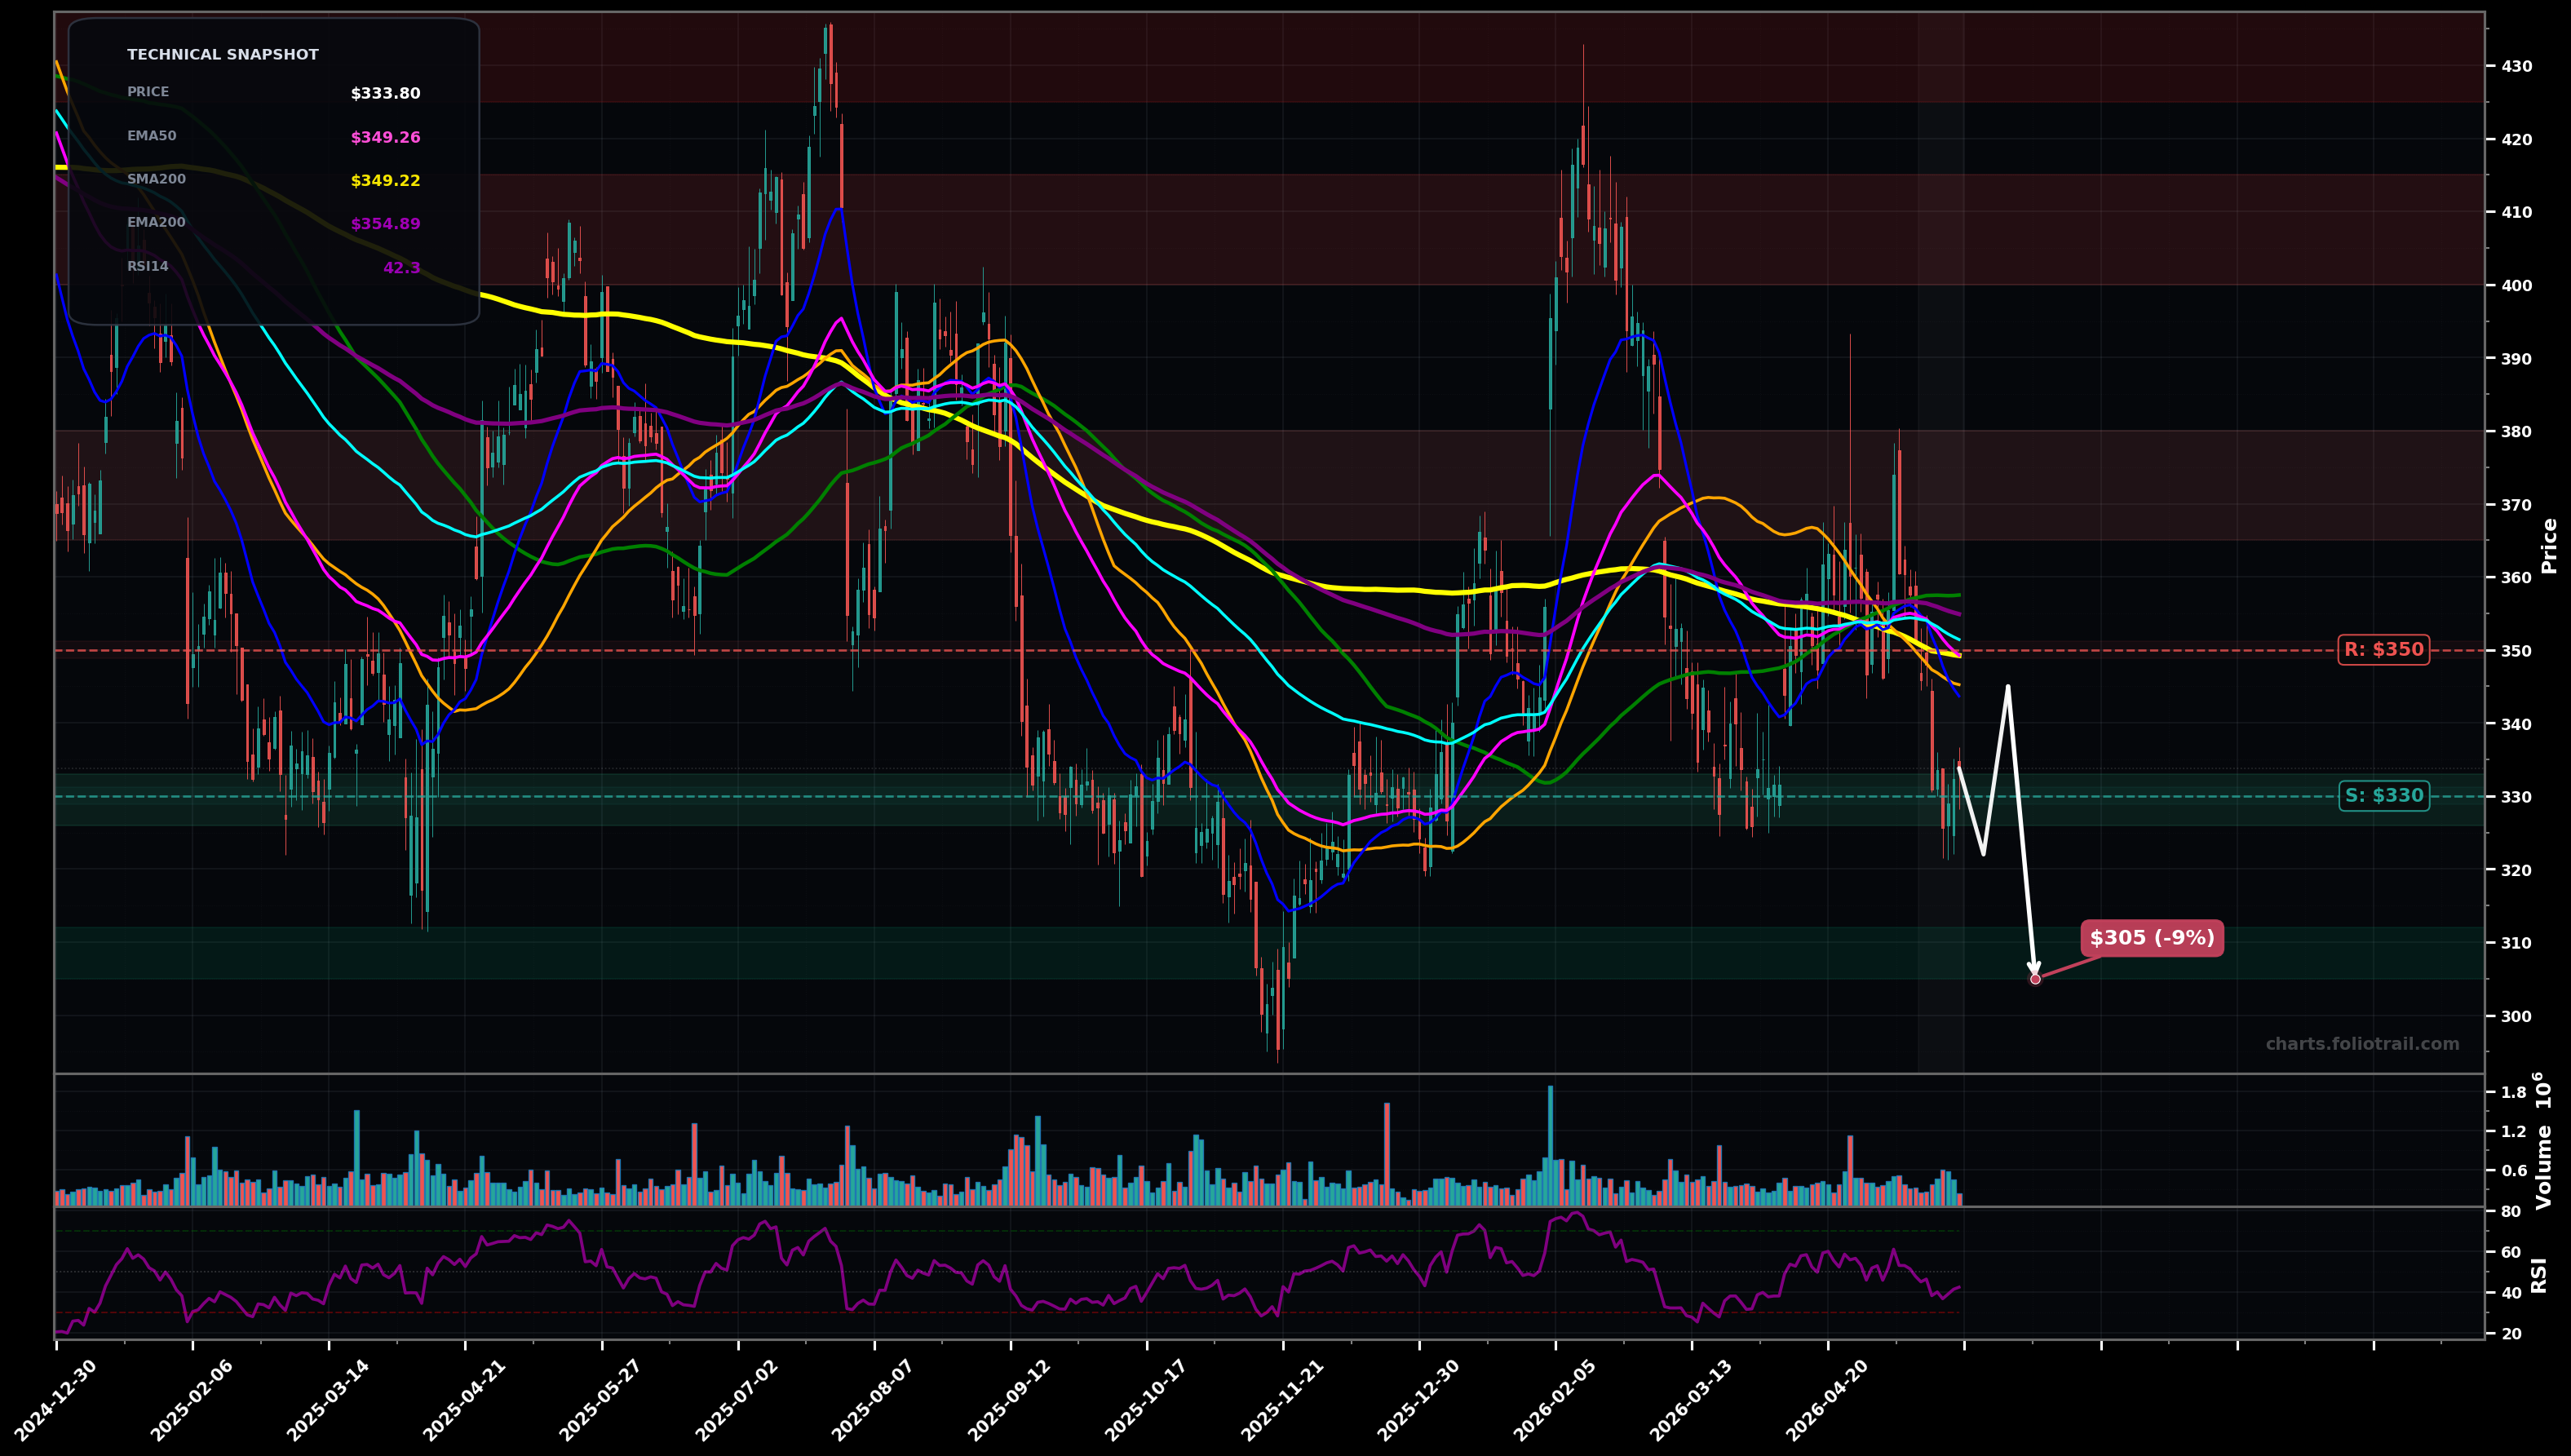
As of May 22, 2026, CSL (Carlisle Companies Inc.) is in a downtrend state on the daily chart, with a confidence level of 67%. Key support is at $330 and key resistance at $350. Price at ~$333.80 is below all key MAs (SMA50/100/200 and EMA50/100/200); recent bounce attempt stalled under the ~$345–$355 MA cluster; RSI ~42 shows weak momentum.
Bearish continuation: sellers defend the ~$345–$350 MA cluster; price rolls over and retests the recent swing-low demand in the low-$320s; if that breaks, extension toward the next lower support zone.
Bullish mean-reversion/base: price holds $330, forms a higher low, then reclaims EMA50/SMA50; squeeze into the heavier resistance band around SMA100/EMA100/SMA200.
Daily close below $330 confirms downtrend continuation toward the prior demand zone.
Two consecutive daily closes above $351 would invalidate the immediate downtrend pressure and favor a base/reversal attempt.
Scale near the swing-low support ($330) first; add on a controlled retest/undercut into low-$320s; deploy heavier only if capitulation tags the next support band near low-$310s/$300s (fib-style extension zone from the last downswing).
Trim into prior supply/major swing-resistance (Feb spike/reversal area) as price stretches above the MA cluster; progressively reduce as it approaches the prior peak zone where Elliott Wave-style wave-5 exhaustion risk increases.
As of May 22, 2026, CSL (Carlisle Companies Inc.) is in a downtrend state on the daily chart with 67% confidence. Price at ~$333.80 is below all key MAs (SMA50/100/200 and EMA50/100/200); recent bounce attempt stalled under the ~$345–$355 MA cluster; RSI ~42 shows weak momentum.
On the daily timeframe, CSL has key support at $330 and key resistance at $350. The most likely scenario (bearish) targets $322 and $305, with a revert level at $345.
CSL (Carlisle Companies Inc.) is currently classified as downtrend on the daily chart, with 67% confidence. Confirmation requires: Daily close below $330 confirms downtrend continuation toward the prior demand zone. This would be invalidated by: Two consecutive daily closes above $351 would invalidate the immediate downtrend pressure and favor a base/reversal attempt.
The most likely scenario (bearish) targets $322 and $305, with a revert level at $345. The alternative scenario (bullish) targets $352 and $365.
Multi-layer AI agents analyse 200+ stocks across daily, weekly, and monthly timeframes — producing market state classifications, price scenarios with targets, and position entry/exit levels. Daily charts updated every trading day at 6 PM ET. Weekly charts refresh Fridays. Monthly charts refresh on the last trading day of each month. No paywall. No sign-up required.
Built by Foliotrail.
All content on this website — including charts, analysis, price targets, support/resistance levels, and position zones — is generated entirely by AI and provided for educational and informational purposes only.
This is not financial advice. NEXUSNOIR VENTURES SL (the operator of this website) is not a registered investment adviser or broker-dealer. You should not make investment decisions based solely on this information. Always do your own research and consult a qualified financial advisor.
By continuing, you acknowledge that you have read and agree to our full disclaimer & terms of use and privacy policy.