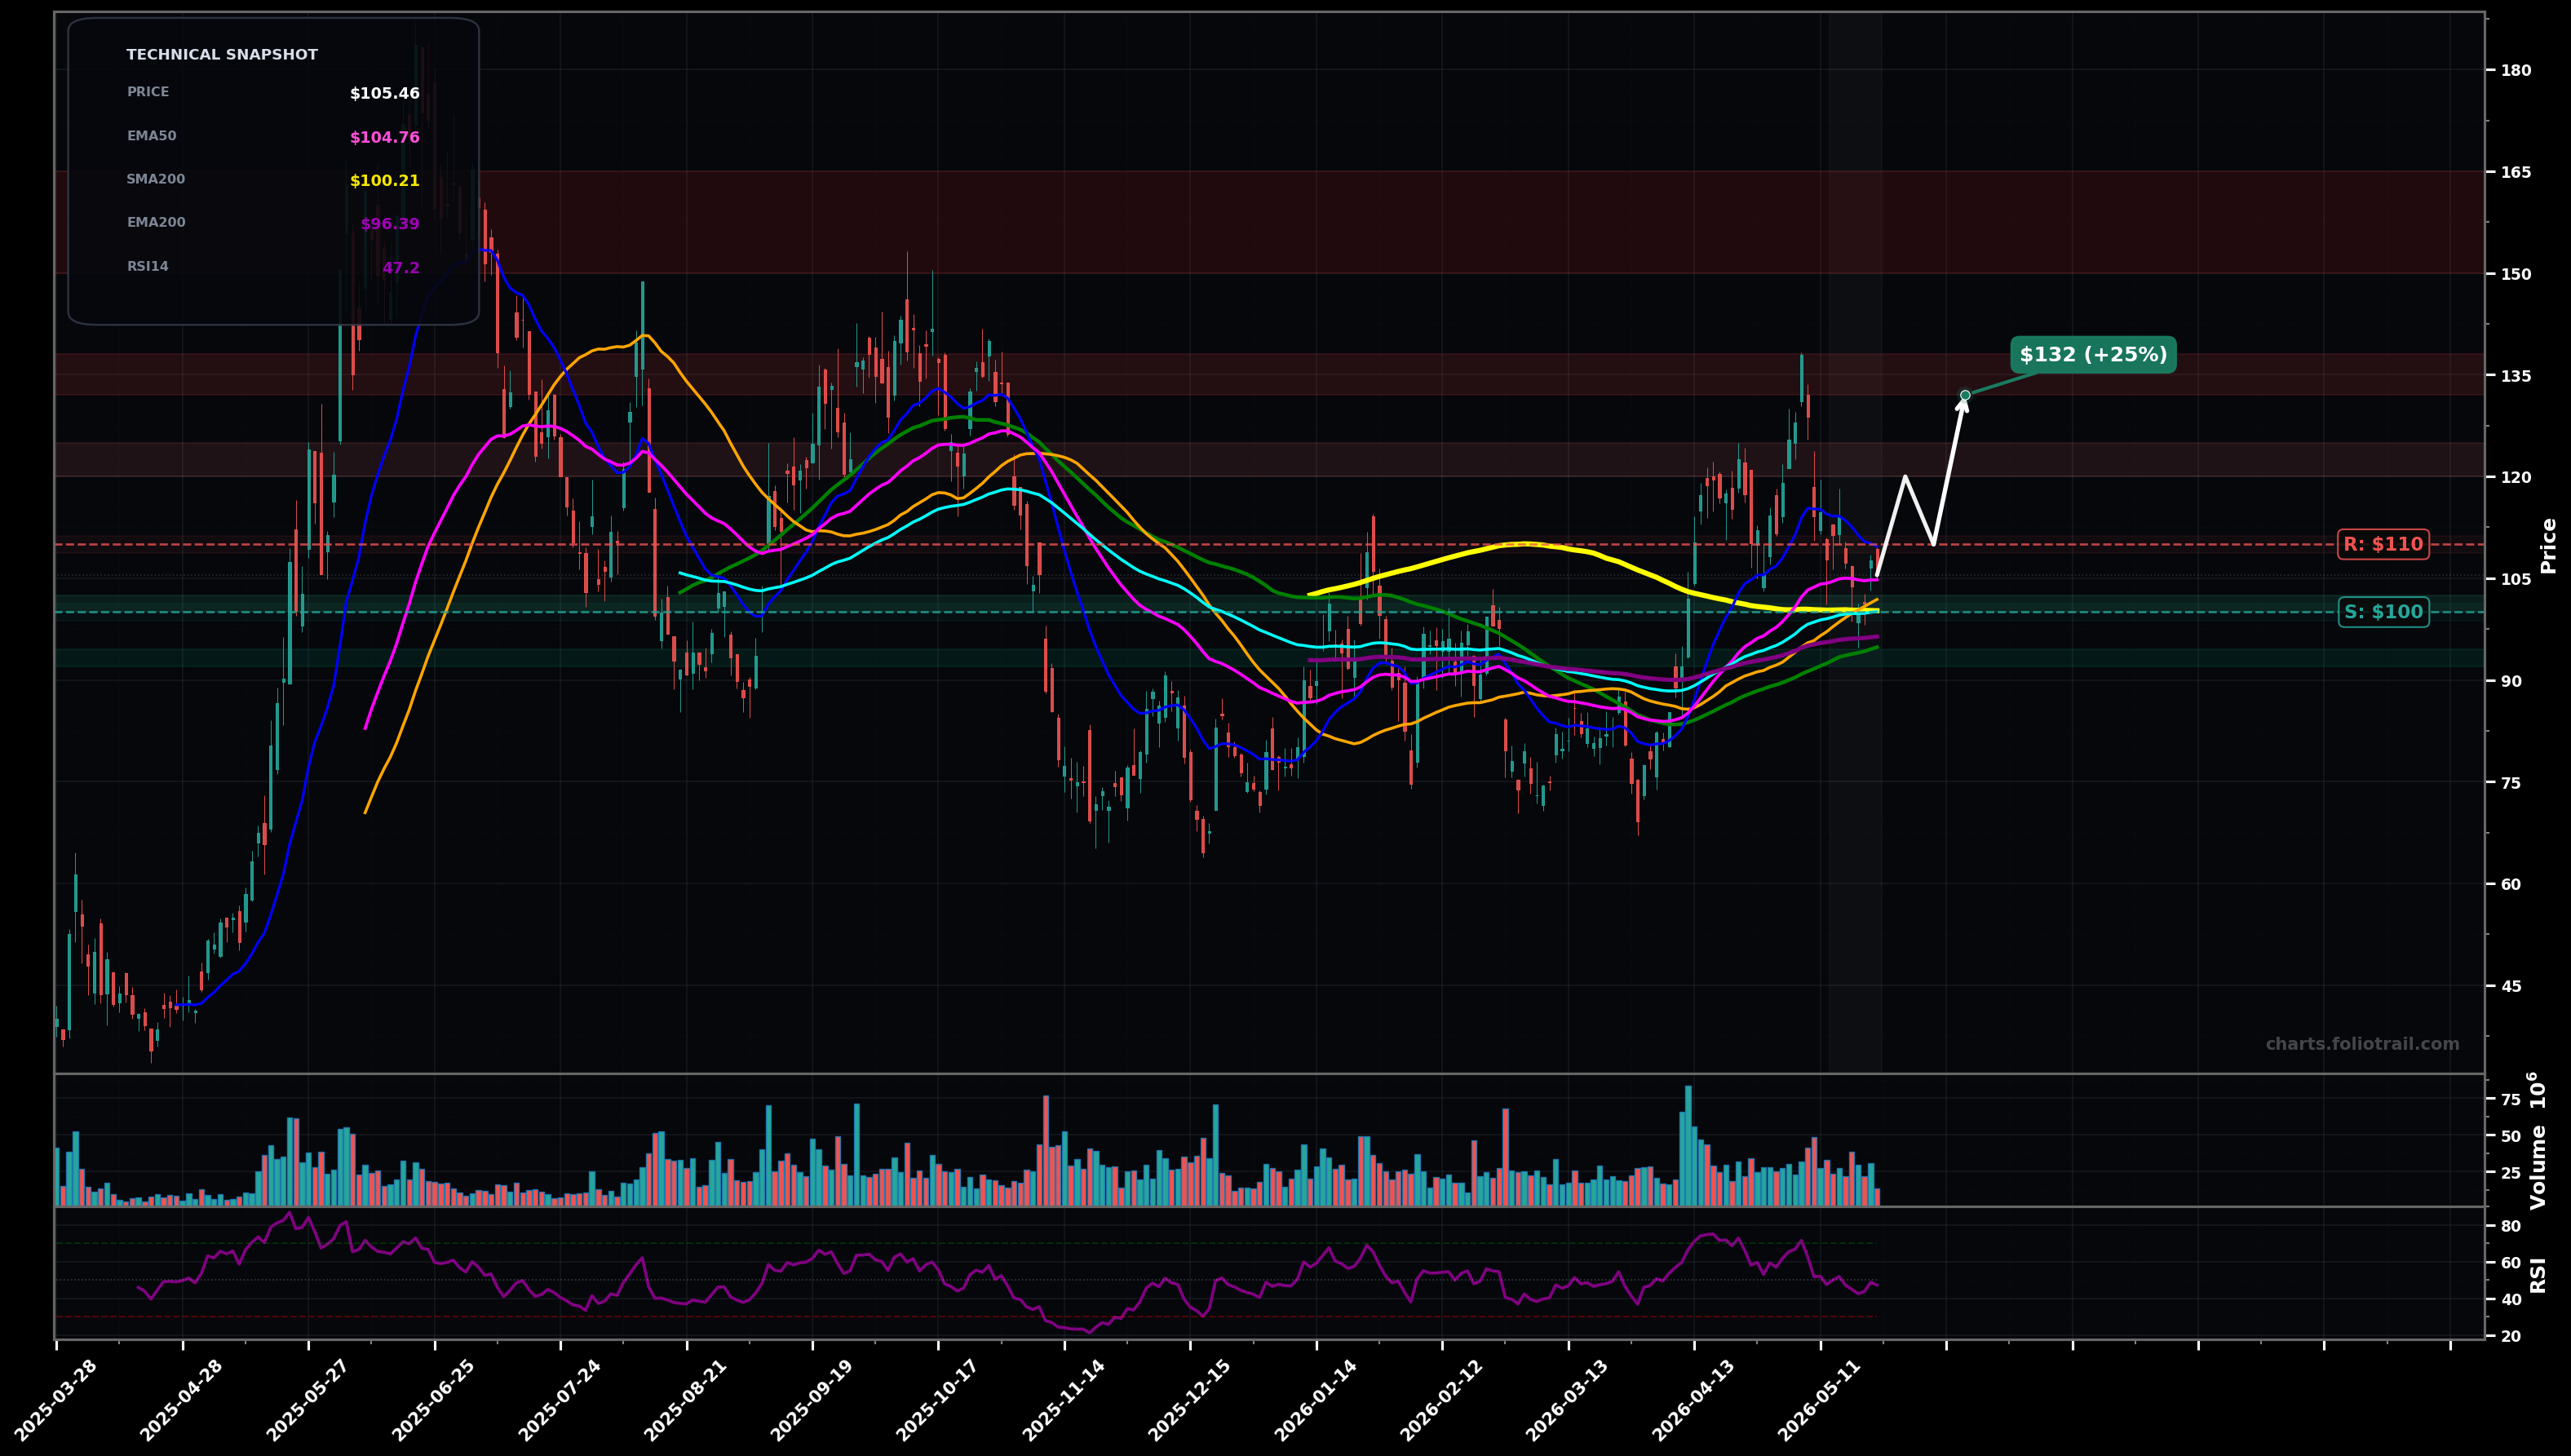
As of May 22, 2026, CRWV (CoreWeave, Inc.) is in a choppy range state on the daily chart, with a confidence level of 58%. Key support is at $100 and key resistance at $110. Price at $105.46 pulled back after a sharp run-up (~$135) and is now sitting near the EMA50 ($104.76) while still above the EMA100 ($100.09) and most SMAs; RSI ~47 shows momentum reset.
Range resolution higher: buyers defend $100-$102, price reclaims $110 and rotates back toward the prior breakdown area near $120, with supply likely into $128-$135 (prior swing zone).
Range fails: price loses $100, triggers a deeper pullback toward the bigger support cluster (EMA200 ~$96.39 / SMA100 ~$94.84) and potentially a full retrace into the low-$90s if sellers press.
Daily close above $110.00 followed by a second close holding above $110.00 (reclaim/hold of the near-term range top & MA cluster).
Daily close below $100.00 (loss of EMA100 $100.09 and breakdown from the current mid-range).
Start near EMA100/$100 pivot support; add at EMA200 confluence (~$96) and prior base; heavy add near SMA100 (~$94.8) / lower range support where invalidation is clearer.
Trim into overhead supply from the last impulse leg (mean reversion resistance $120+), trim harder near prior swing high zone ($132-$138), and fully exit only if price becomes multi-year stretched toward former major peak area ($150+).
As of May 22, 2026, CRWV (CoreWeave, Inc.) is in a choppy range state on the daily chart with 58% confidence. Price at $105.46 pulled back after a sharp run-up (~$135) and is now sitting near the EMA50 ($104.76) while still above the EMA100 ($100.09) and most SMAs; RSI ~47 shows momentum reset.
On the daily timeframe, CRWV has key support at $100 and key resistance at $110. The most likely scenario (bullish) targets $120 and $132, with a revert level at $110.
CRWV (CoreWeave, Inc.) is currently classified as choppy range on the daily chart, with 58% confidence. Confirmation requires: Daily close above $110.00 followed by a second close holding above $110.00 (reclaim/hold of the near-term range top & MA cluster). This would be invalidated by: Daily close below $100.00 (loss of EMA100 $100.09 and breakdown from the current mid-range).
The most likely scenario (bullish) targets $120 and $132, with a revert level at $110. The alternative scenario (bearish) targets $96.5 and $90.0.
Multi-layer AI agents analyse 200+ stocks across daily, weekly, and monthly timeframes — producing market state classifications, price scenarios with targets, and position entry/exit levels. Daily charts updated every trading day at 6 PM ET. Weekly charts refresh Fridays. Monthly charts refresh on the last trading day of each month. No paywall. No sign-up required.
Built by Foliotrail.
All content on this website — including charts, analysis, price targets, support/resistance levels, and position zones — is generated entirely by AI and provided for educational and informational purposes only.
This is not financial advice. NEXUSNOIR VENTURES SL (the operator of this website) is not a registered investment adviser or broker-dealer. You should not make investment decisions based solely on this information. Always do your own research and consult a qualified financial advisor.
By continuing, you acknowledge that you have read and agree to our full disclaimer & terms of use and privacy policy.