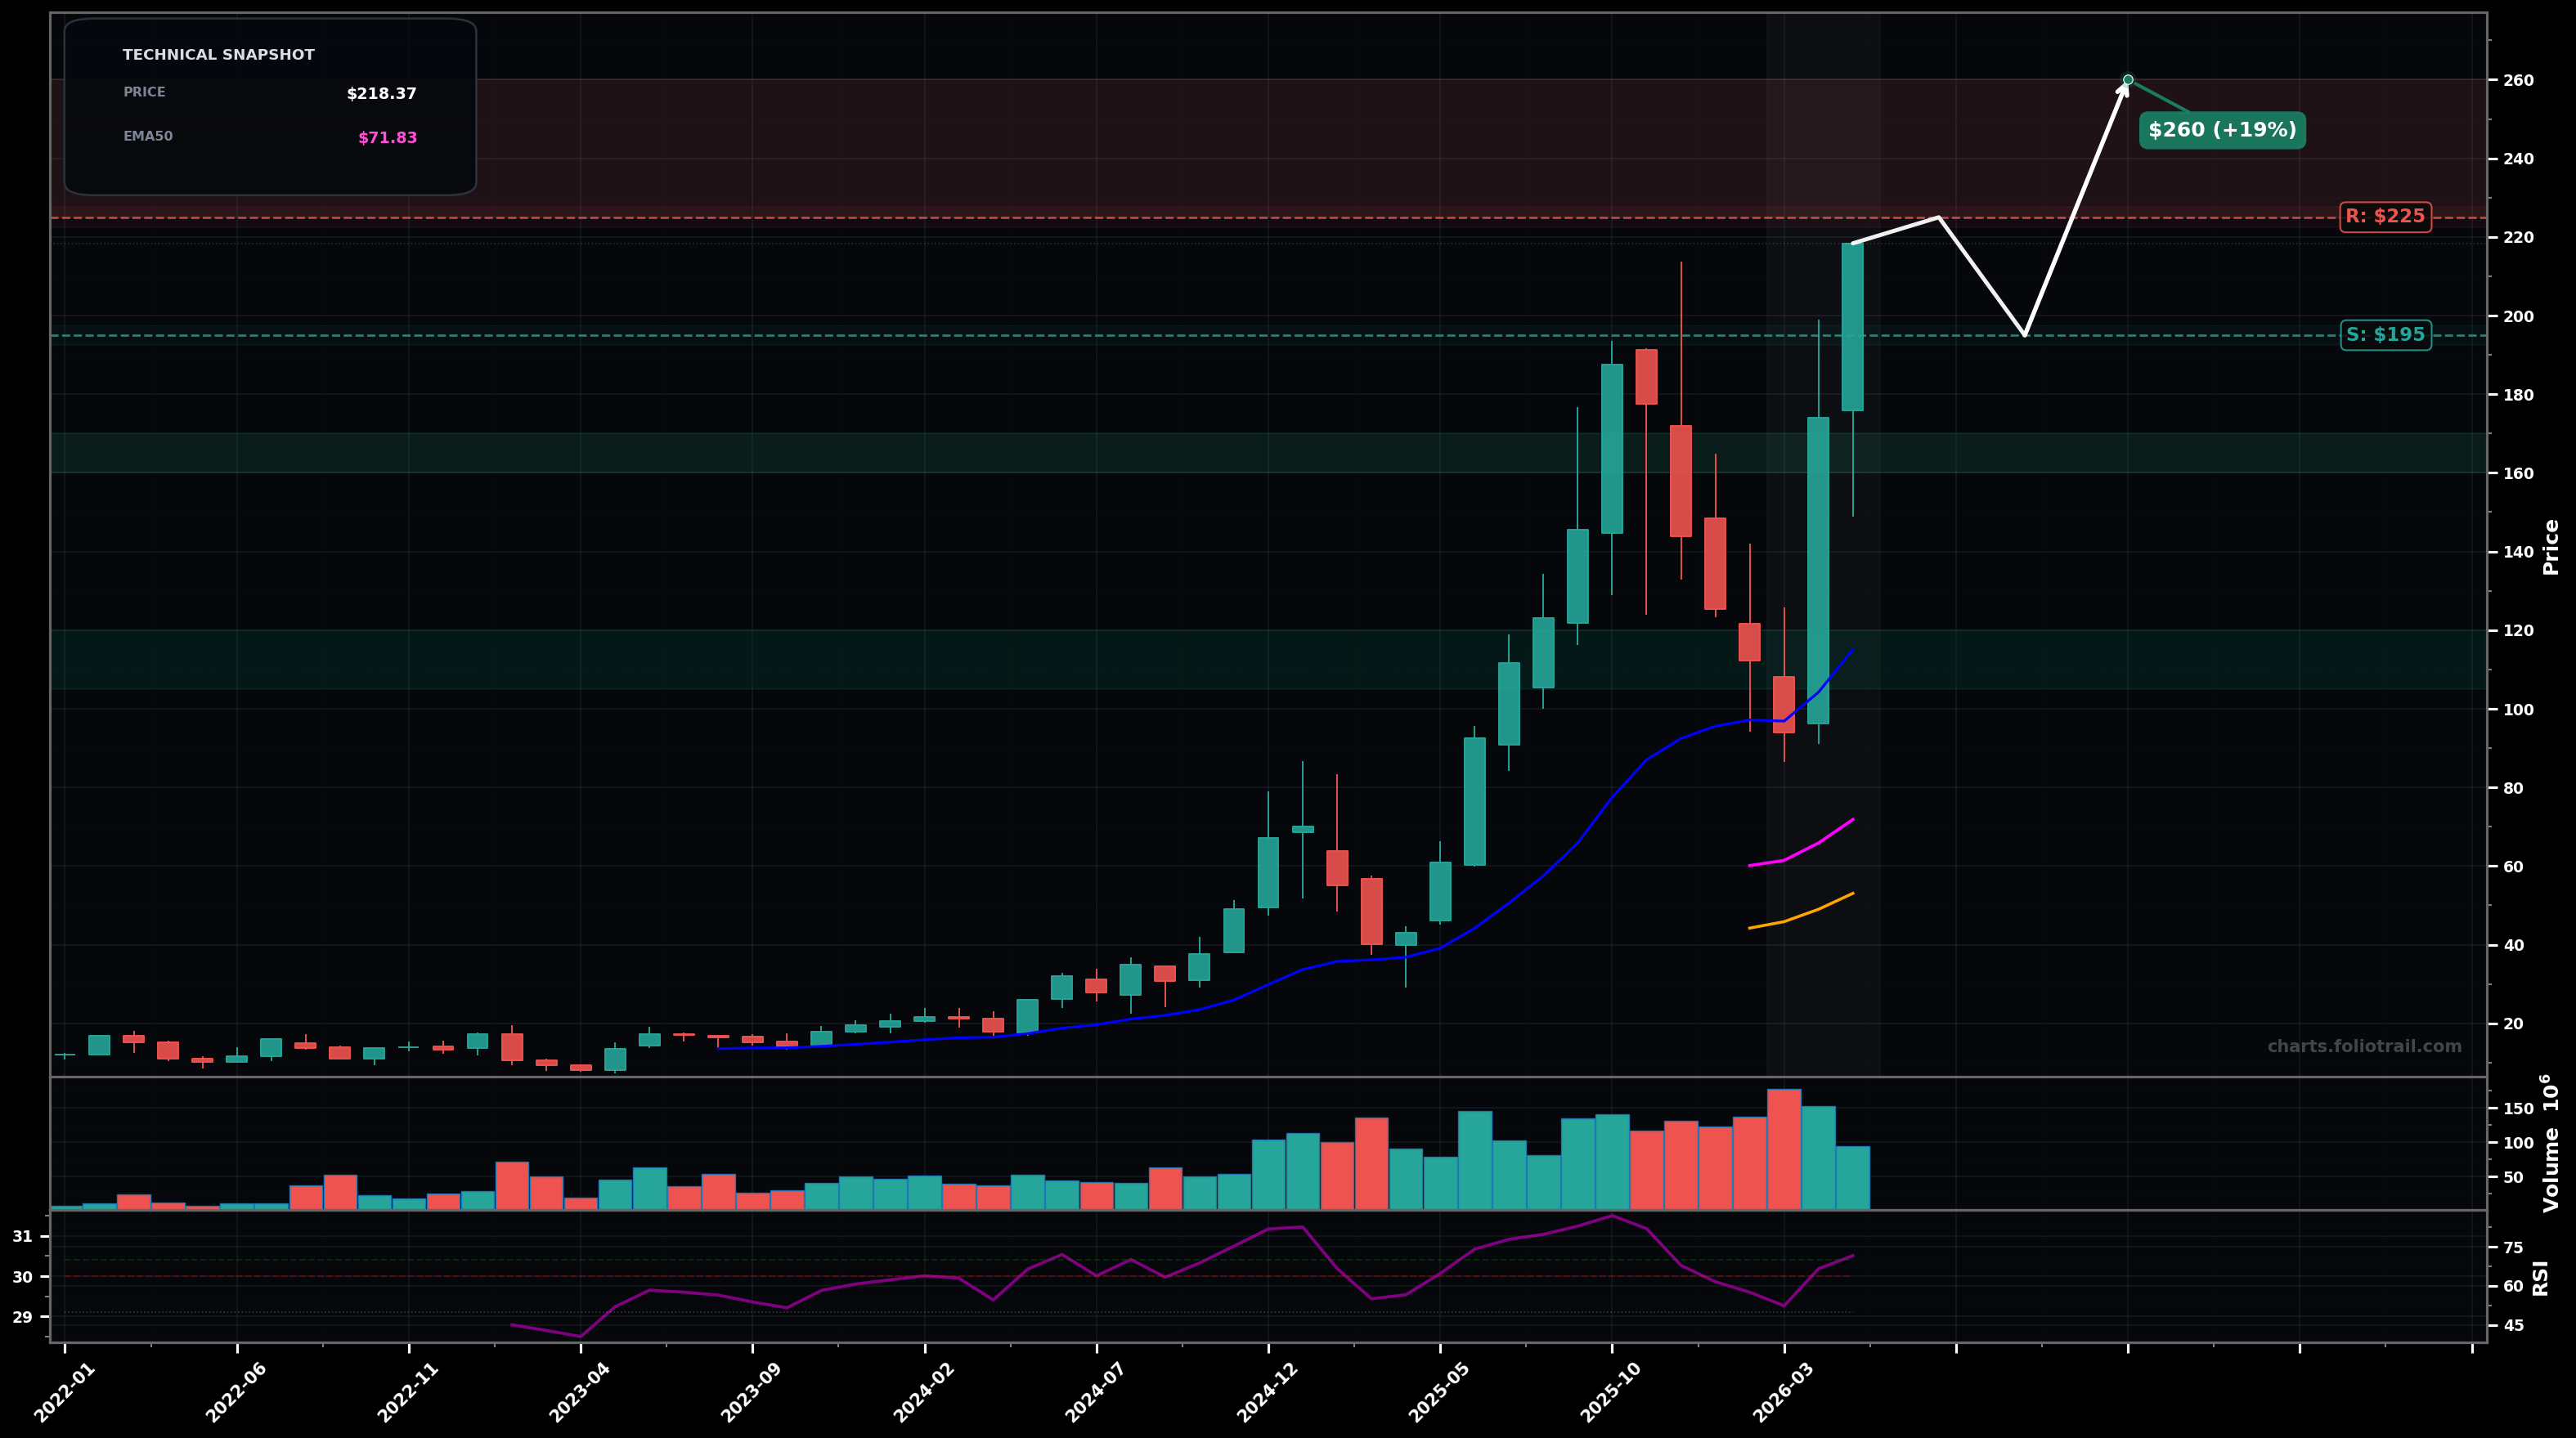
As of May 22, 2026, CRDO (Credo Technology Group Holding Ltd.) is in a parabolic state on the monthly chart, with a confidence level of 72%. Key support is at $195 and key resistance at $225. Monthly candle surged to ~$218 after a sharp pullback into the ~$90–$105 zone, reclaiming prior highs with expanding range; RSI ~71 (hot).
Bullish continuation (Elliott: still in an impulsive Wave 5 extension after a Wave 4 pullback into ~$90–$105); price consolidates briefly then grinds higher, but expect sharp wicks.
Mean-reversion / blow-off risk: after the parabolic push, a multi-month pullback retraces part of the last leg (Fib of ~$90 low to ~$218 high), testing breakout support before deciding trend continuation.
Monthly close holds above $195 (former supply/round-number zone).
Monthly close below $150 (breaks the last major breakout support / prior swing area).
Buy-the-dip zones align with prior breakout shelf (~$160–$170), deeper Fib/structure support (~$140–$150), and last major swing-low/turn area near the EMA200 region (~$105–$120).
Trims staged into parabolic extension zones: first into immediate resistance/new-highs, then into further multiple-expansion where price is extremely detached from EMA50/EMA200; final close only if a sustained blow-off advance occurs.
As of May 22, 2026, CRDO (Credo Technology Group Holding Ltd.) is in a parabolic state on the monthly chart with 72% confidence. Monthly candle surged to ~$218 after a sharp pullback into the ~$90–$105 zone, reclaiming prior highs with expanding range; RSI ~71 (hot).
On the monthly timeframe, CRDO has key support at $195 and key resistance at $225. The most likely scenario (bullish) targets $225 and $260, with a revert level at $195.
CRDO (Credo Technology Group Holding Ltd.) is currently classified as parabolic on the monthly chart, with 72% confidence. Confirmation requires: Monthly close holds above $195 (former supply/round-number zone). This would be invalidated by: Monthly close below $150 (breaks the last major breakout support / prior swing area).
The most likely scenario (bullish) targets $225 and $260, with a revert level at $195. The alternative scenario (bearish) targets $170 and $140.
Multi-layer AI agents analyse 200+ stocks across daily, weekly, and monthly timeframes — producing market state classifications, price scenarios with targets, and position entry/exit levels. Daily charts updated every trading day at 6 PM ET. Weekly charts refresh Fridays. Monthly charts refresh on the last trading day of each month. No paywall. No sign-up required.
Built by Foliotrail.
All content on this website — including charts, analysis, price targets, support/resistance levels, and position zones — is generated entirely by AI and provided for educational and informational purposes only.
This is not financial advice. NEXUSNOIR VENTURES SL (the operator of this website) is not a registered investment adviser or broker-dealer. You should not make investment decisions based solely on this information. Always do your own research and consult a qualified financial advisor.
By continuing, you acknowledge that you have read and agree to our full disclaimer & terms of use and privacy policy.