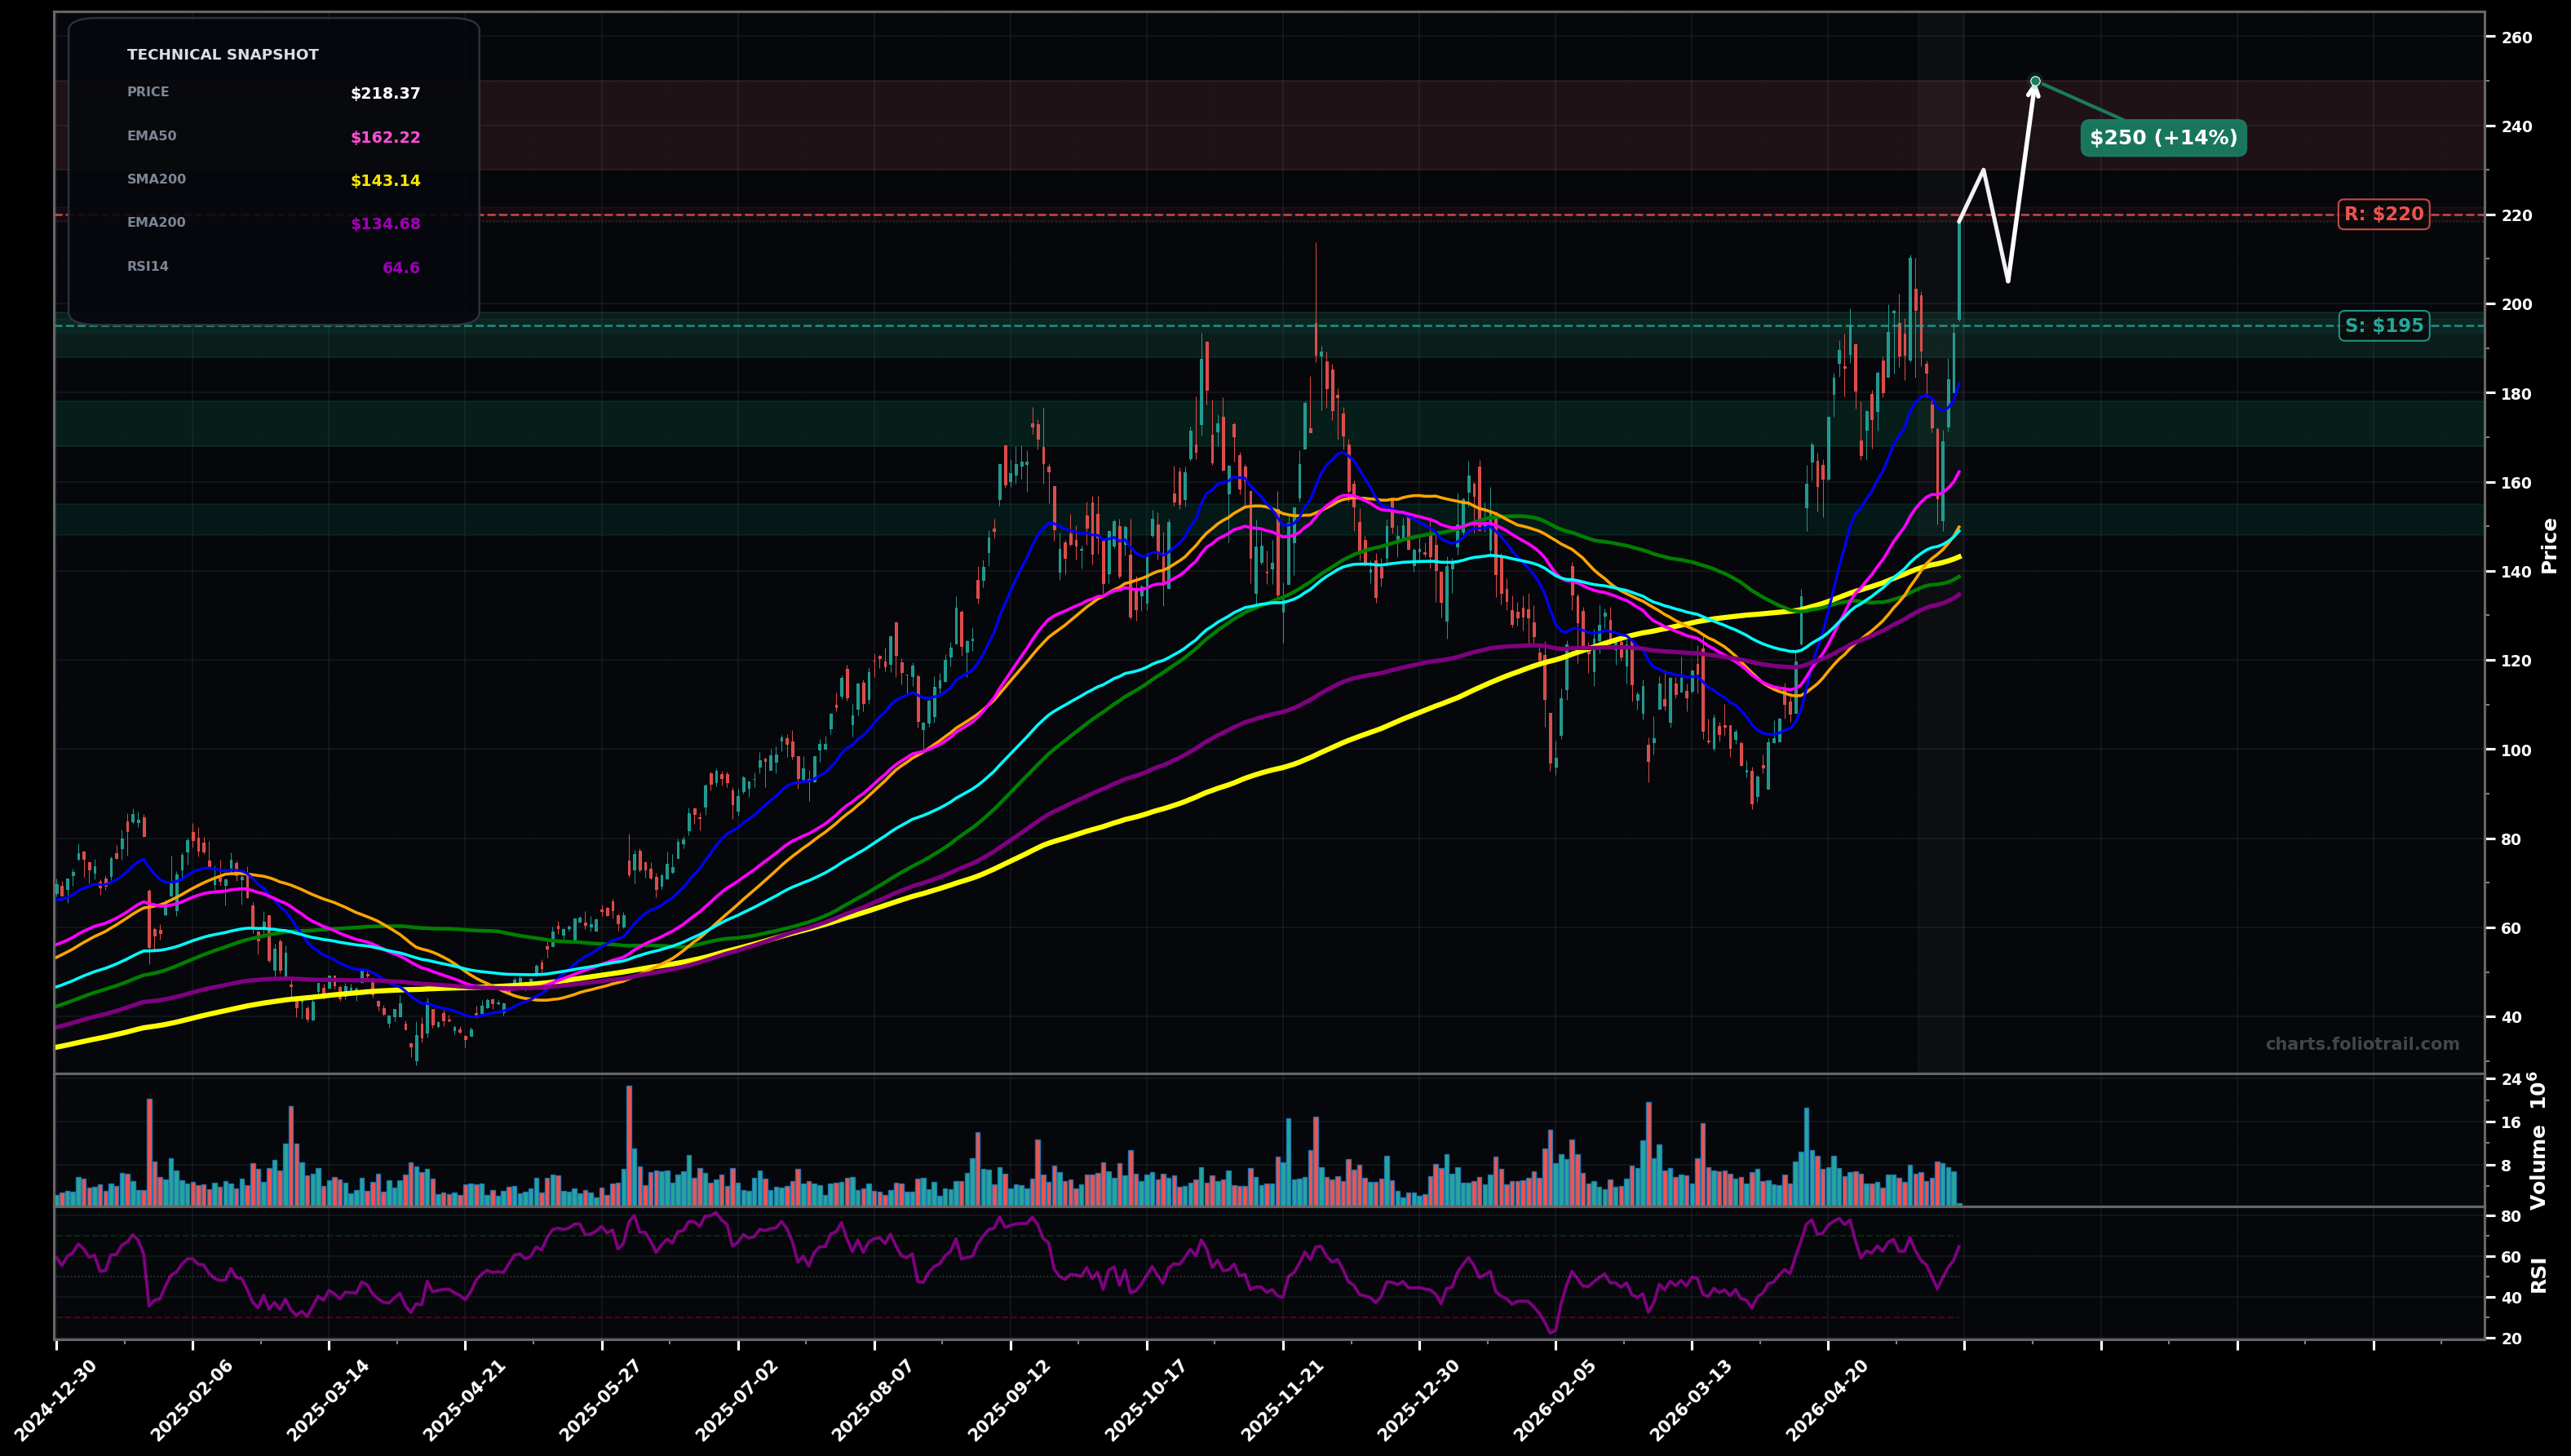
As of May 22, 2026, CRDO (Credo Technology Group Holding Ltd.) is in a uptrend state on the daily chart, with a confidence level of 78%. Key support is at $195 and key resistance at $220. Strong impulsive rally to new swing highs; price ($218.37) is well above EMA50 ($162.22) & EMA100 ($148.97) with RSI-14 ~64.6, suggesting momentum but mildly stretched.
Bullish continuation: brief consolidation/pullback holds above prior breakout area, then another push higher as wave (5) extends; watch for a controlled retest into ~$200–$205 before expansion.
Deeper corrective pullback: rally looks like an Elliott impulse off the $90–$100 low and may be in late-stage (wave 5); price rejects near $220 and mean-reverts toward EMA50/EMA100 before resuming trend.
Hold above $205 on 2+ daily closes (breakout acceptance) while EMA50 keeps rising
Daily close below $178 (loss of EMA20/near-term structure), increasing odds of a deeper pullback to EMA50/100
Buy-the-dip bias in uptrend: start near breakout retest/support (~$195), add near EMA50 zone (~$162–$175), heavy add near EMA100/SMA100 confluence (~$149–$155).
Trim into extensions above prior ATH ($220) where price is increasingly stretched vs EMA50/100; larger trims/exit if a blow-off move carries far beyond trend MAs (parabolic risk).
As of May 22, 2026, CRDO (Credo Technology Group Holding Ltd.) is in a uptrend state on the daily chart with 78% confidence. Strong impulsive rally to new swing highs; price ($218.37) is well above EMA50 ($162.22) & EMA100 ($148.97) with RSI-14 ~64.6, suggesting momentum but mildly stretched.
On the daily timeframe, CRDO has key support at $195 and key resistance at $220. The most likely scenario (bullish) targets $230 and $250, with a revert level at $205.
CRDO (Credo Technology Group Holding Ltd.) is currently classified as uptrend on the daily chart, with 78% confidence. Confirmation requires: Hold above $205 on 2+ daily closes (breakout acceptance) while EMA50 keeps rising This would be invalidated by: Daily close below $178 (loss of EMA20/near-term structure), increasing odds of a deeper pullback to EMA50/100
The most likely scenario (bullish) targets $230 and $250, with a revert level at $205. The alternative scenario (bearish) targets $175 and $150.
Multi-layer AI agents analyse 200+ stocks across daily, weekly, and monthly timeframes — producing market state classifications, price scenarios with targets, and position entry/exit levels. Daily charts updated every trading day at 6 PM ET. Weekly charts refresh Fridays. Monthly charts refresh on the last trading day of each month. No paywall. No sign-up required.
Built by Foliotrail.
All content on this website — including charts, analysis, price targets, support/resistance levels, and position zones — is generated entirely by AI and provided for educational and informational purposes only.
This is not financial advice. NEXUSNOIR VENTURES SL (the operator of this website) is not a registered investment adviser or broker-dealer. You should not make investment decisions based solely on this information. Always do your own research and consult a qualified financial advisor.
By continuing, you acknowledge that you have read and agree to our full disclaimer & terms of use and privacy policy.