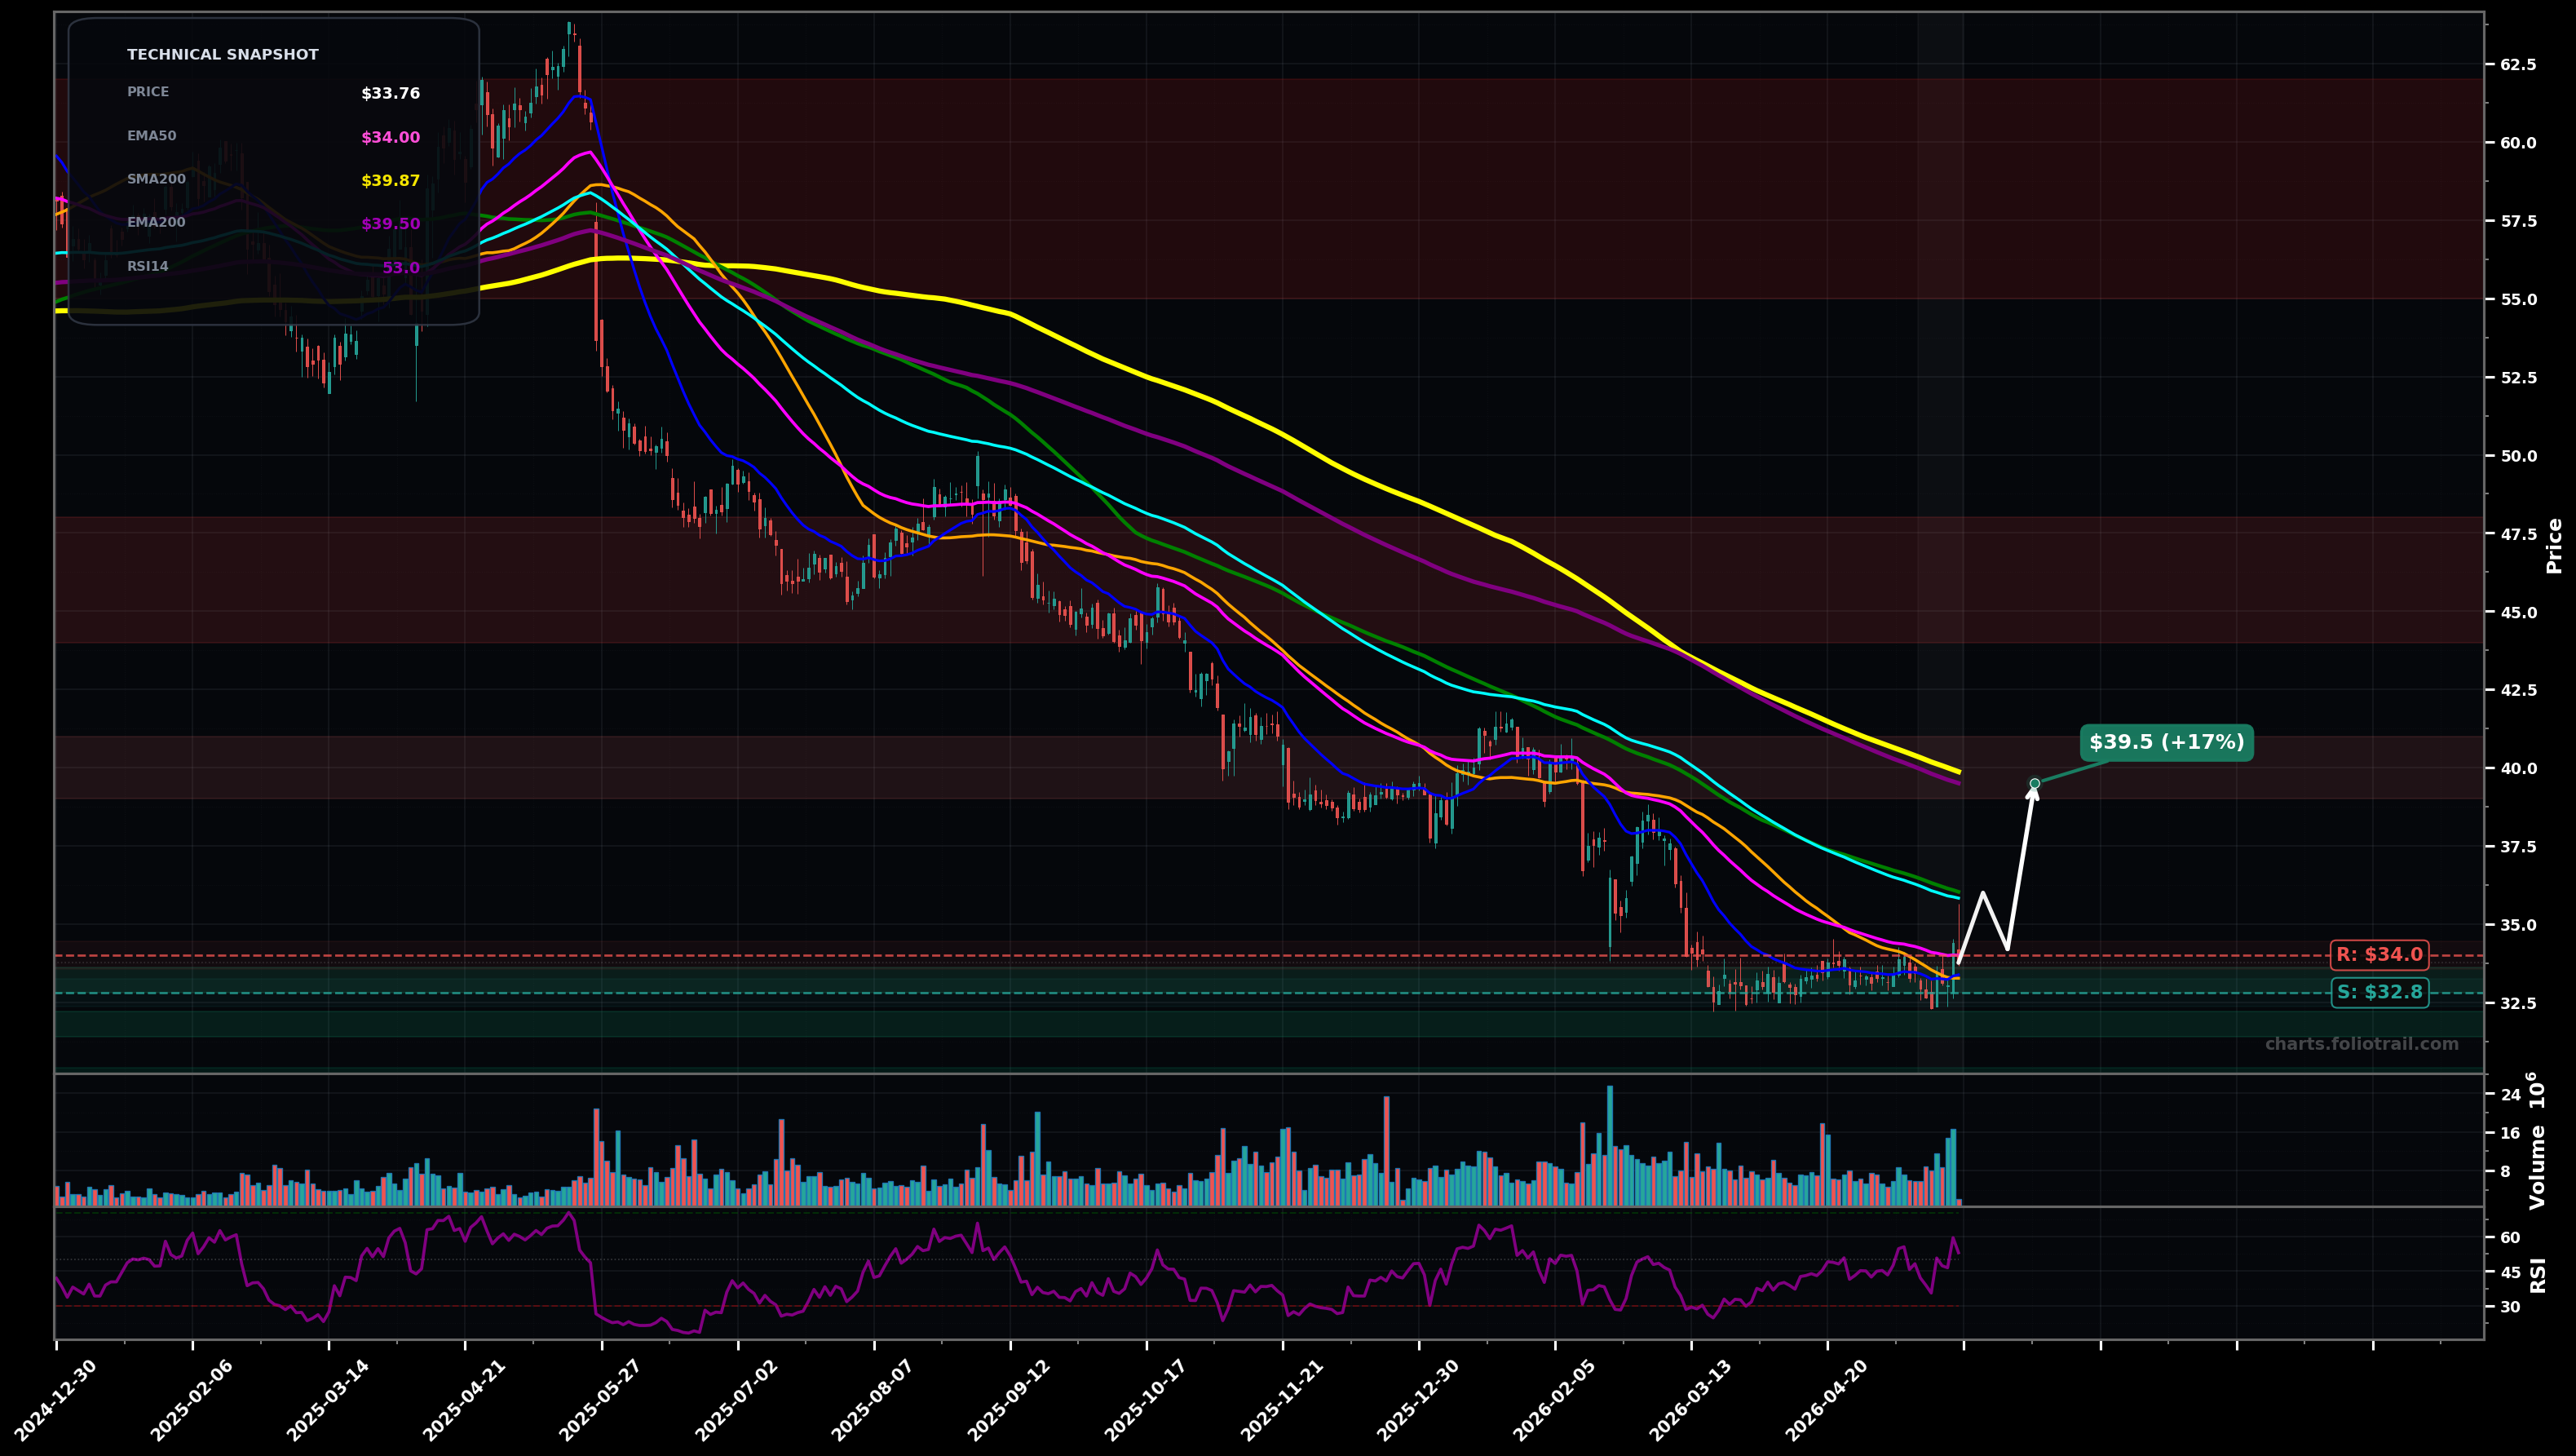
As of May 22, 2026, CPRT (Copart Inc.) is in a bottoming attempt state on the daily chart, with a confidence level of 58%. Key support is at $32.8 and key resistance at $34.0. Price is basing around $33–$34 after a long LH/LL decline; small bounce with RSI ~53 but still under most major MAs (EMA50/EMA100/SMA100).
Base holds and price grinds higher into the declining MA stack; likely a relief rally that tests the first major supply zone (EMA100/SMA100), then a pullback retest before a second push.
Downtrend reasserts: failure at $34–$36 and breakdown of the base triggers a continuation leg to fresh lows, consistent with an Elliott Wave-like final C/5 washout.
2+ daily closes above $34.00 and then a push/hold above $36.00 (EMA100/SMA100 area).
Daily close below $32.50 (loss of the recent base/swing-low support).
Start near repeated base support; add on breakdown-retest of support; heavy add only on capitulation into next Fibonacci/round-number demand zone while trend MAs still overhead.
Trim into major MA resistances (SMA200/EMA200 zone near low $40s then higher supply); fully close only if a full mean-reversion/multi-year retest toward prior breakdown region occurs.
As of May 22, 2026, CPRT (Copart Inc.) is in a bottoming attempt state on the daily chart with 58% confidence. Price is basing around $33–$34 after a long LH/LL decline; small bounce with RSI ~53 but still under most major MAs (EMA50/EMA100/SMA100).
On the daily timeframe, CPRT has key support at $32.8 and key resistance at $34.0. The most likely scenario (bullish) targets $36.0 and $39.5, with a revert level at $34.2.
CPRT (Copart Inc.) is currently classified as bottoming attempt on the daily chart, with 58% confidence. Confirmation requires: 2+ daily closes above $34.00 and then a push/hold above $36.00 (EMA100/SMA100 area). This would be invalidated by: Daily close below $32.50 (loss of the recent base/swing-low support).
The most likely scenario (bullish) targets $36.0 and $39.5, with a revert level at $34.2. The alternative scenario (bearish) targets $31.5 and $29.5.
Multi-layer AI agents analyse 200+ stocks across daily, weekly, and monthly timeframes — producing market state classifications, price scenarios with targets, and position entry/exit levels. Daily charts updated every trading day at 6 PM ET. Weekly charts refresh Fridays. Monthly charts refresh on the last trading day of each month. No paywall. No sign-up required.
Built by Foliotrail.
All content on this website — including charts, analysis, price targets, support/resistance levels, and position zones — is generated entirely by AI and provided for educational and informational purposes only.
This is not financial advice. NEXUSNOIR VENTURES SL (the operator of this website) is not a registered investment adviser or broker-dealer. You should not make investment decisions based solely on this information. Always do your own research and consult a qualified financial advisor.
By continuing, you acknowledge that you have read and agree to our full disclaimer & terms of use and privacy policy.