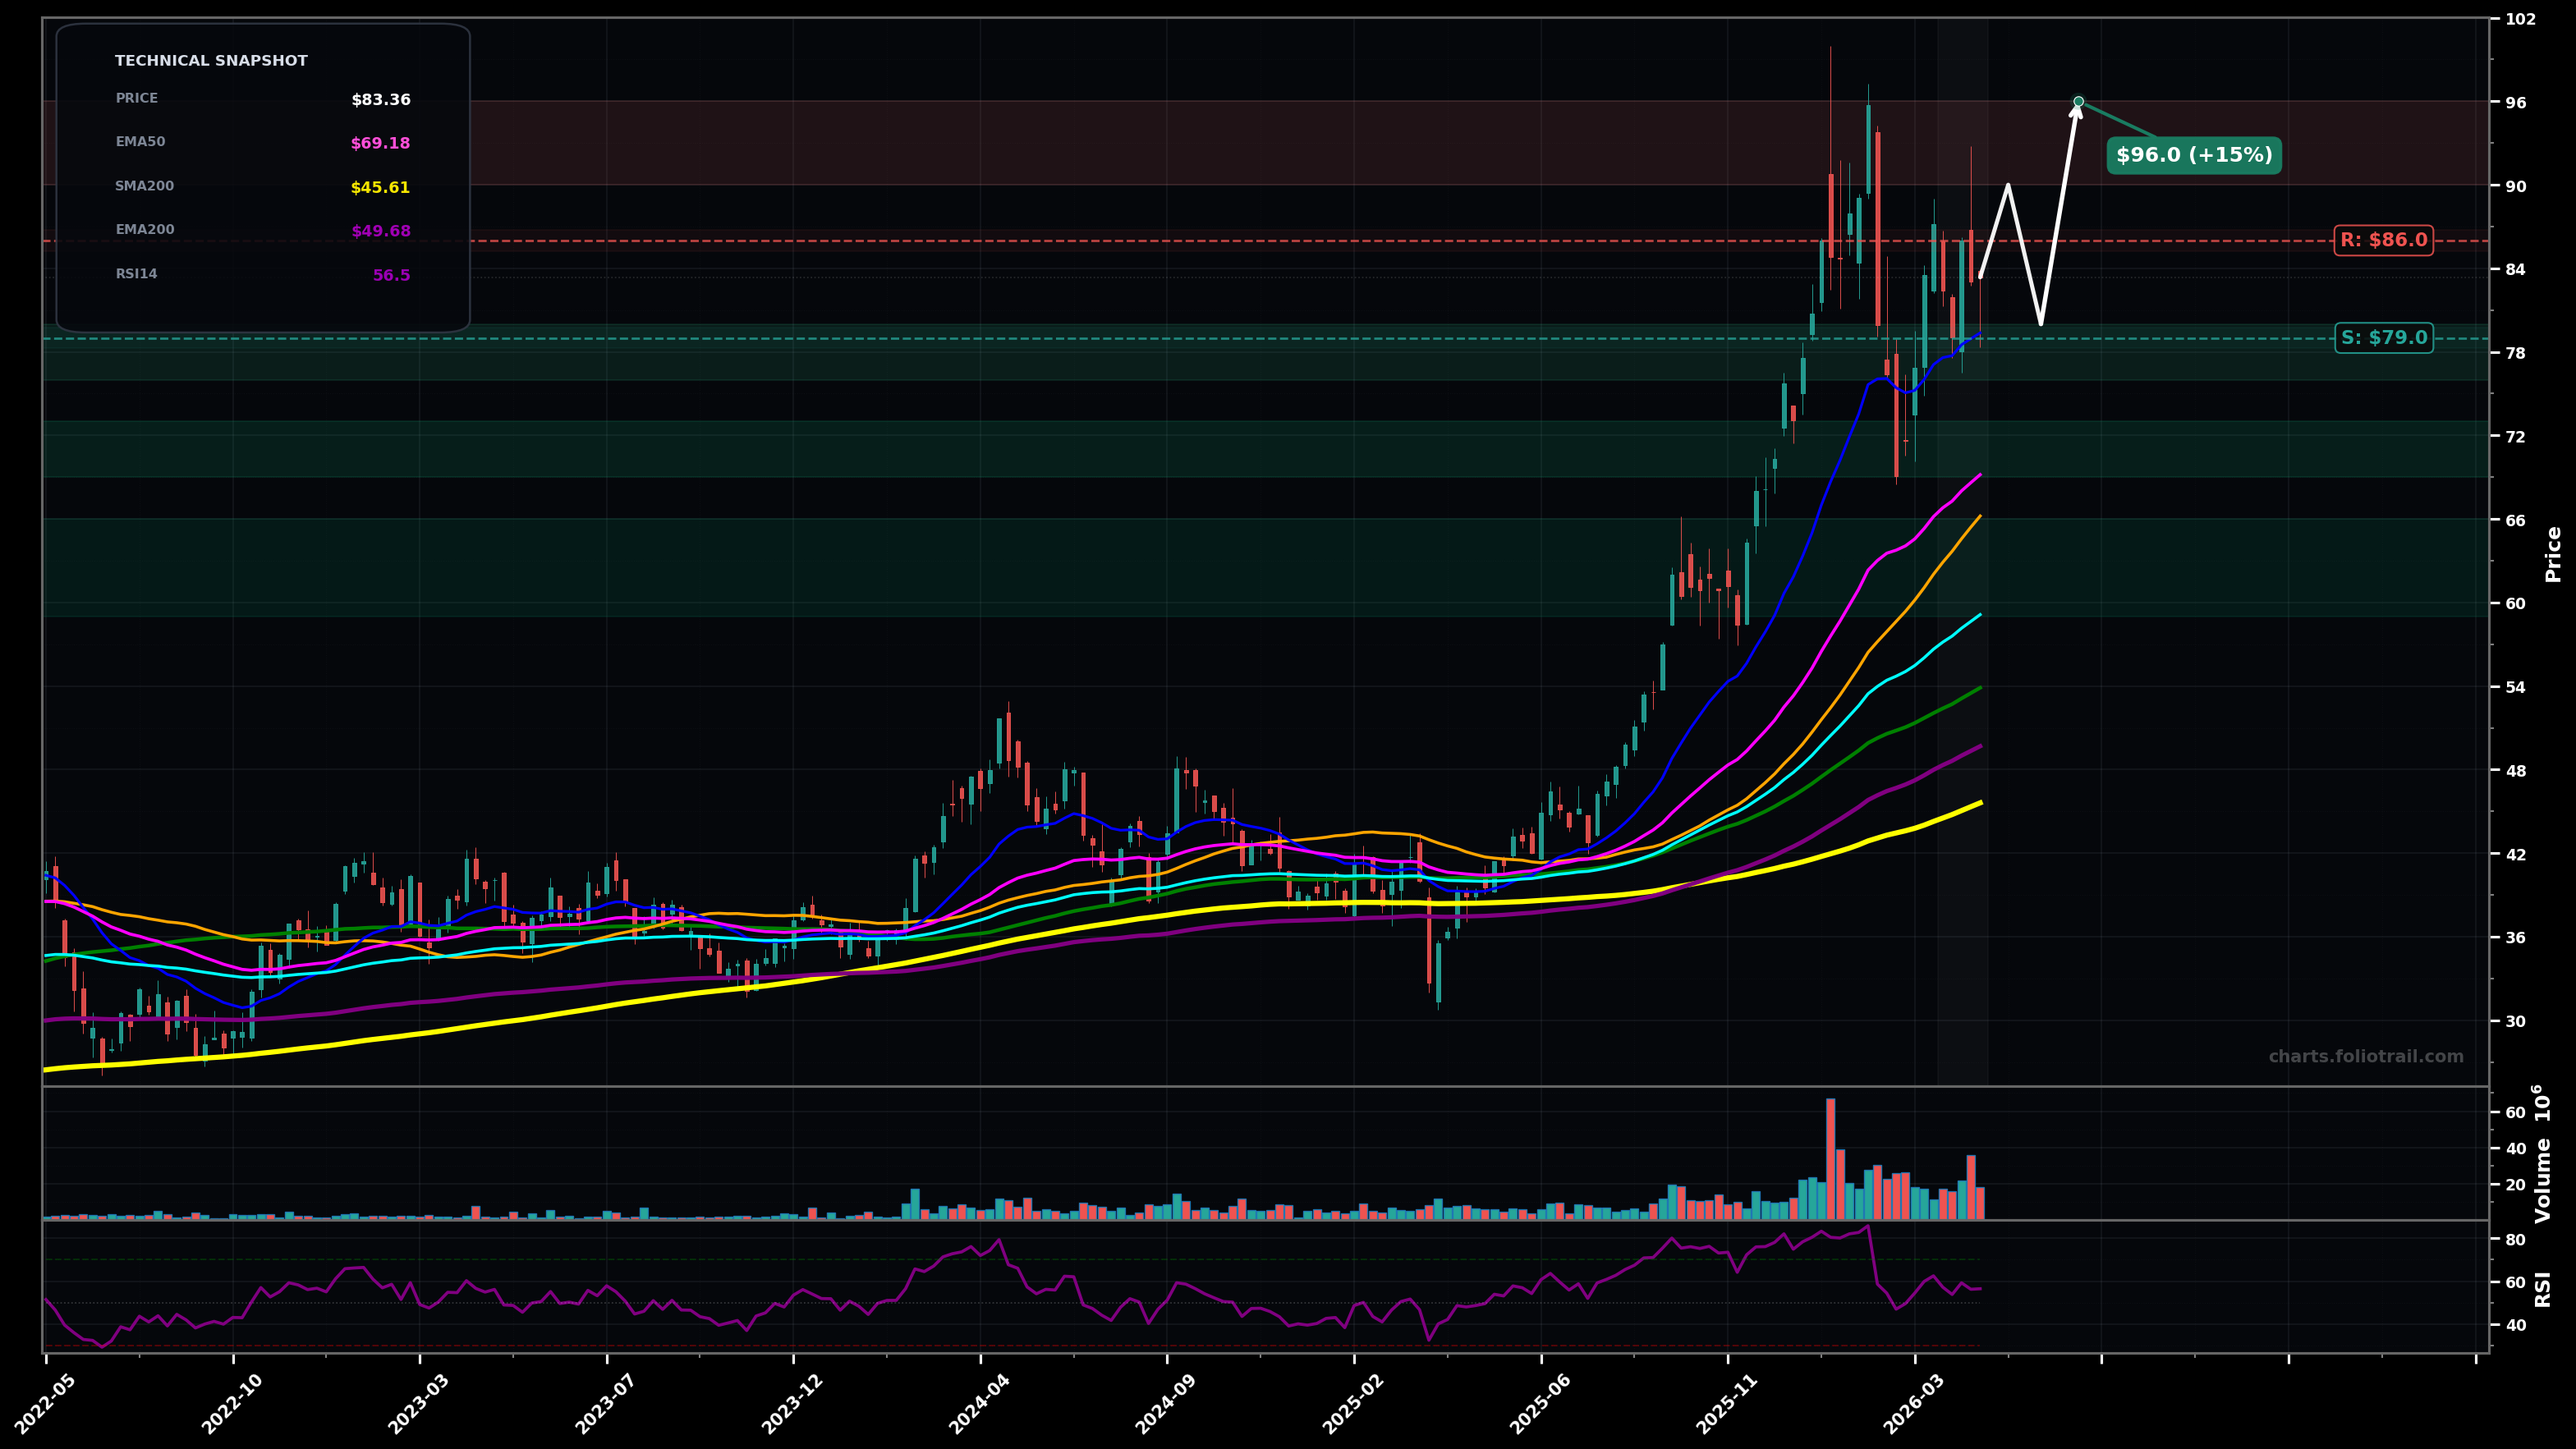
As of May 22, 2026, COPX (Global X Copper Miners ETF) is in a volatility expansion state on the weekly chart, with a confidence level of 68%. Key support is at $79.0 and key resistance at $86.0. COPX is consolidating after a sharp weekly breakout run; price ~$83.36 is holding well above rising EMA50 (~$69) and EMA100 (~$59) but remains below the recent peak near the mid-$90s.
Bullish continuation: consolidation resolves higher as a Wave (4) type pause completes, followed by a Wave (5) attempt toward the prior high; expect a brief retest of the $79–$81 area before a push.
Bearish mean-reversion: the post-spike structure behaves like an A-B-C correction; loss of $79 opens a deeper pullback toward the rising EMA50 and prior breakout shelf.
2+ weekly closes above $86 while holding EMA20 (~$79) would confirm continued expansion to the upside.
Weekly close below $79 (loss of EMA20 area) shifts odds toward a deeper mean-reversion.
Start near EMA20/support ($79) on controlled pullbacks; add at EMA50 (~$69) / breakout retest; heavy add near EMA100–SMA50 confluence (~$59–$66) if the correction deepens but trend structure remains intact.
Trim into prior-high retest ($90–$96) where supply showed up; larger trims if price becomes 1–2 volatility units above rising averages (blow-off risk); close if a multi-year extension phase prints far above long MAs (parabolic/late-cycle stretch).
As of May 22, 2026, COPX (Global X Copper Miners ETF) is in a volatility expansion state on the weekly chart with 68% confidence. COPX is consolidating after a sharp weekly breakout run; price ~$83.36 is holding well above rising EMA50 (~$69) and EMA100 (~$59) but remains below the recent peak near the mid-$90s.
On the weekly timeframe, COPX has key support at $79.0 and key resistance at $86.0. The most likely scenario (bullish) targets $90.0 and $96.0, with a revert level at $80.0.
COPX (Global X Copper Miners ETF) is currently classified as volatility expansion on the weekly chart, with 68% confidence. Confirmation requires: 2+ weekly closes above $86 while holding EMA20 (~$79) would confirm continued expansion to the upside. This would be invalidated by: Weekly close below $79 (loss of EMA20 area) shifts odds toward a deeper mean-reversion.
The most likely scenario (bullish) targets $90.0 and $96.0, with a revert level at $80.0. The alternative scenario (bearish) targets $73.0 and $69.0.
Multi-layer AI agents analyse 200+ stocks across daily, weekly, and monthly timeframes — producing market state classifications, price scenarios with targets, and position entry/exit levels. Daily charts updated every trading day at 6 PM ET. Weekly charts refresh Fridays. Monthly charts refresh on the last trading day of each month. No paywall. No sign-up required.
Built by Foliotrail.
All content on this website — including charts, analysis, price targets, support/resistance levels, and position zones — is generated entirely by AI and provided for educational and informational purposes only.
This is not financial advice. NEXUSNOIR VENTURES SL (the operator of this website) is not a registered investment adviser or broker-dealer. You should not make investment decisions based solely on this information. Always do your own research and consult a qualified financial advisor.
By continuing, you acknowledge that you have read and agree to our full disclaimer & terms of use and privacy policy.