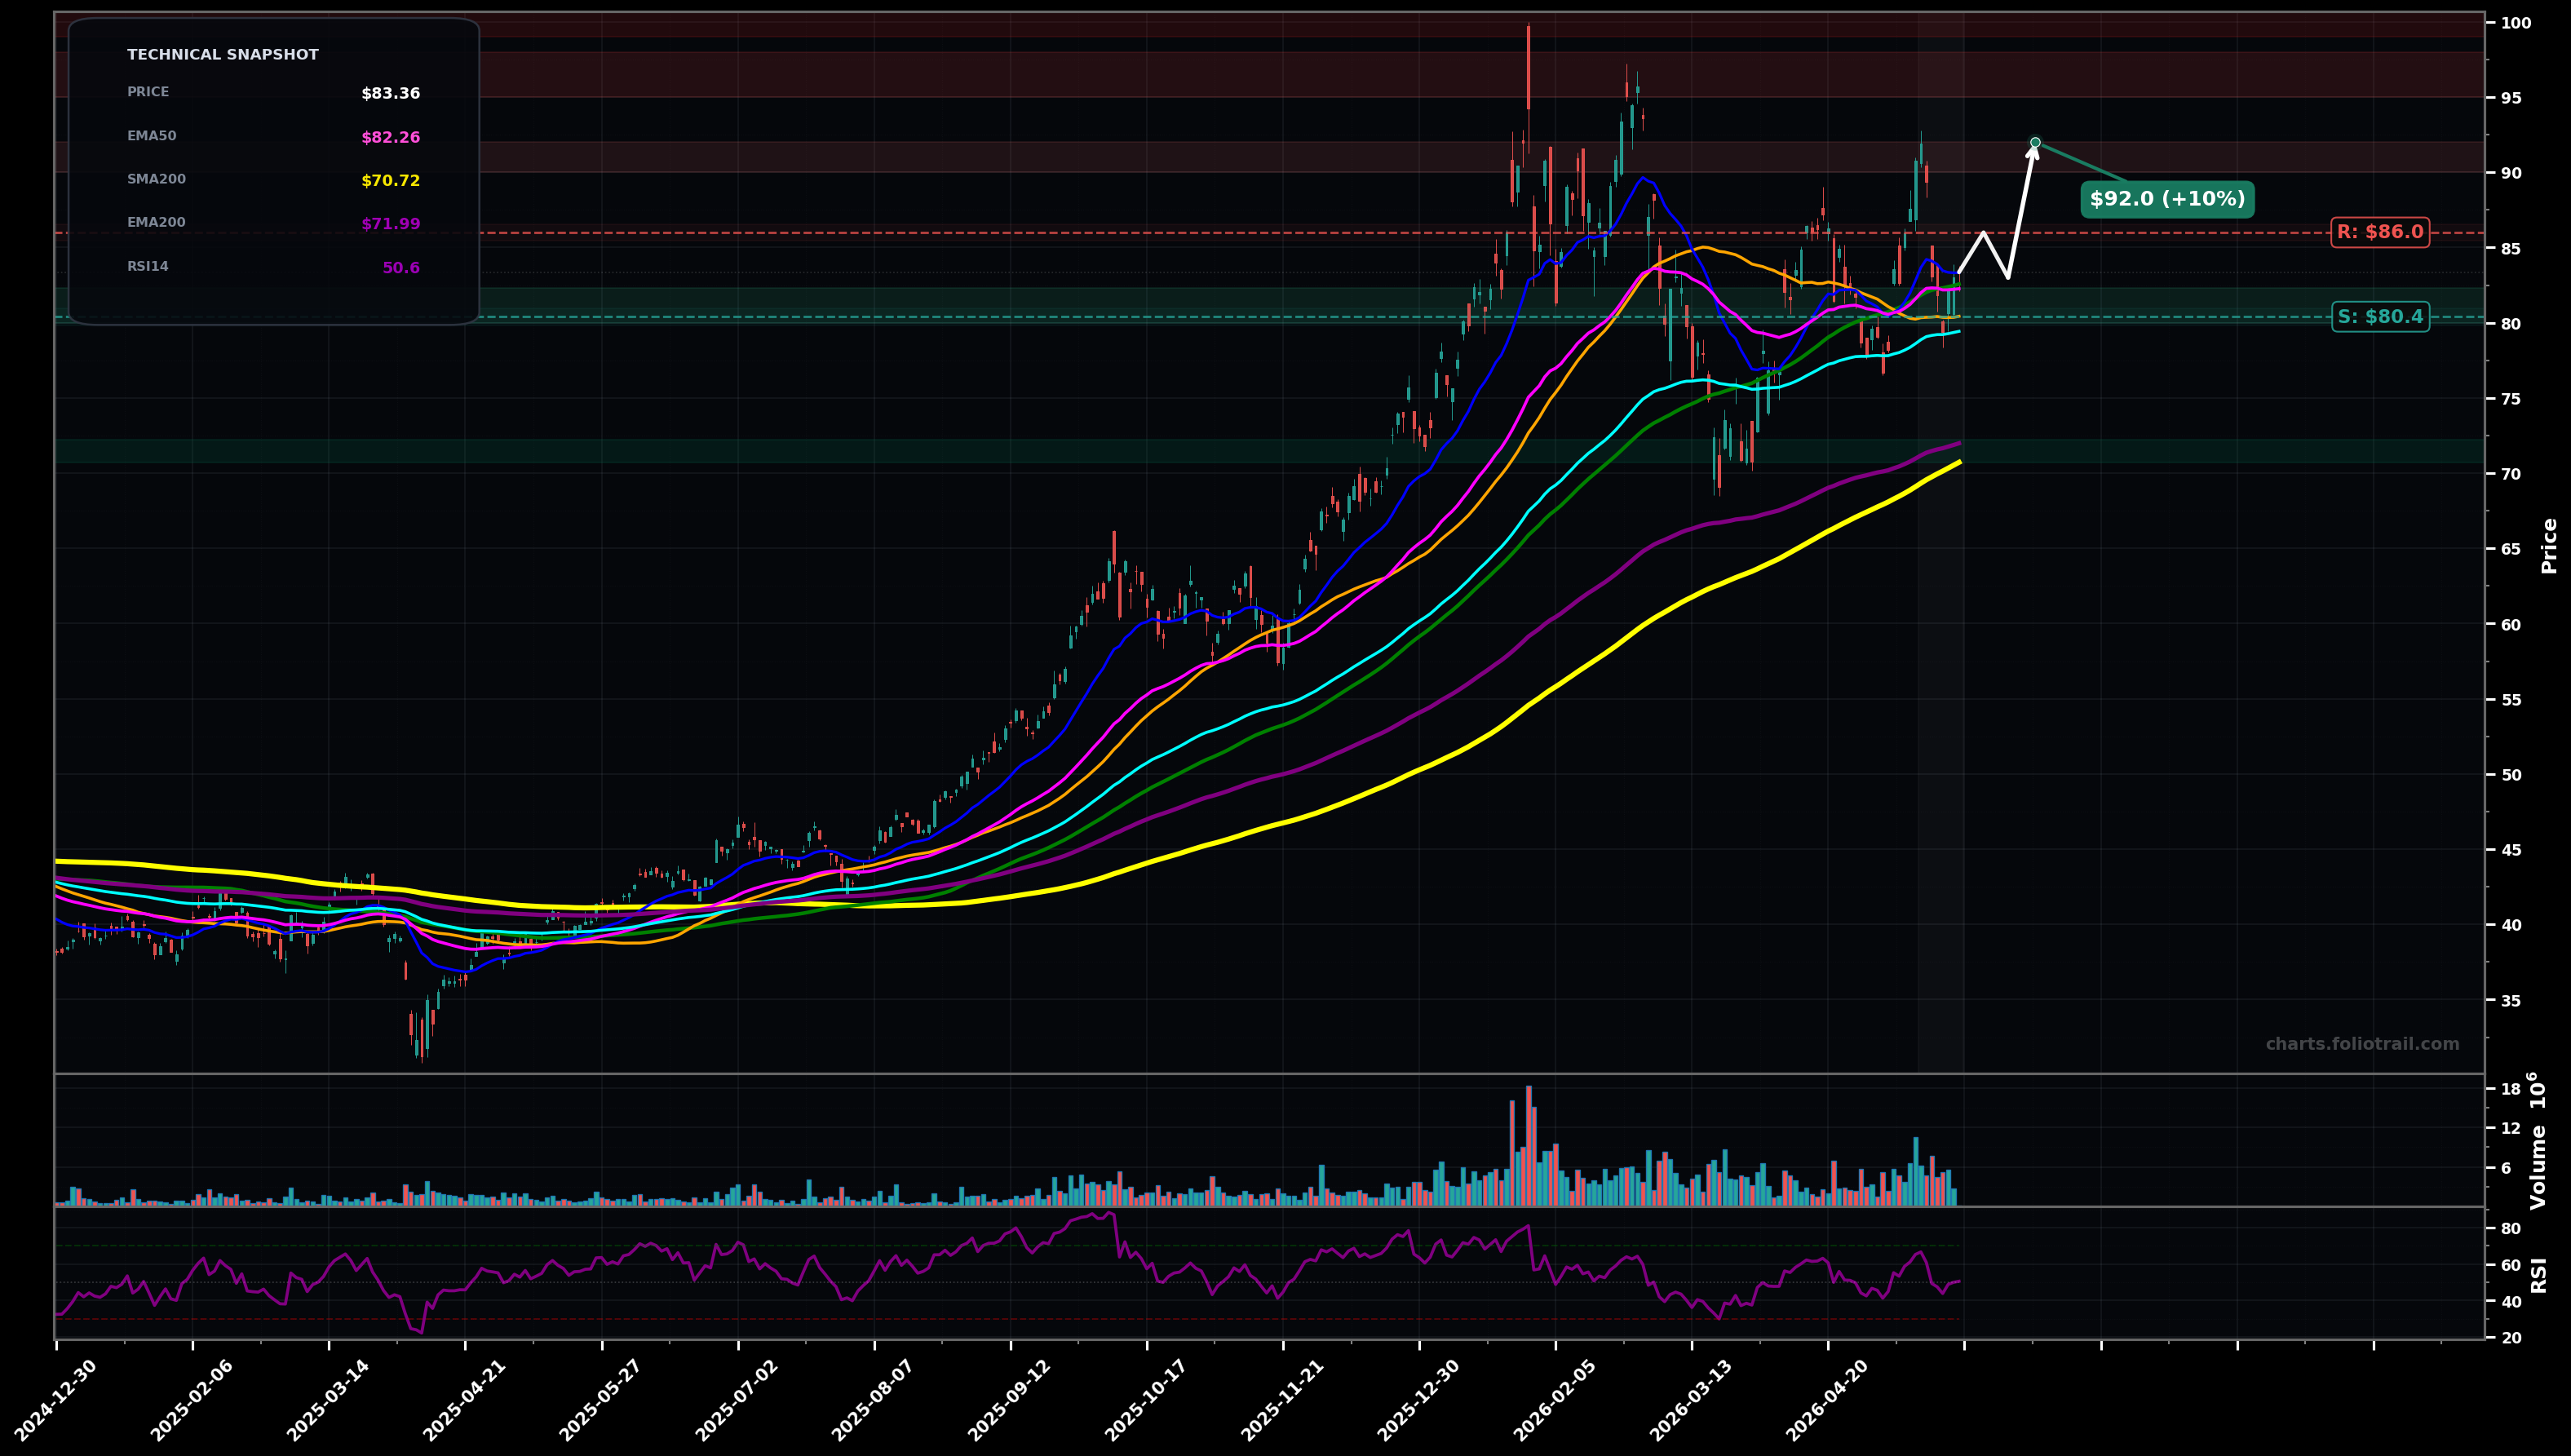
As of May 22, 2026, COPX (Global X Copper Miners ETF) is in a choppy range state on the daily chart, with a confidence level of 66%. Key support is at $80.4 and key resistance at $86.0. Price ~$83.36 is grinding sideways-to-up after a sharp rebound, holding above clustered mid-MAs (SMA50/100/EMA50) with RSI ~50; prior swing high near ~$90+ still overhead.
Range resolves upward: price holds the MA cluster ($80-$83) and pushes through $86, then attempts a retest of the prior swing supply near $90-$92 (possible Wave C/5 pop of the rebound).
Range fails: rejection under $86 leads to a breakdown back into the prior base, first testing EMA100/SMA100 (~$79-$83), and if that fails, a deeper retrace toward the rising long-term MAs (~$72).
2+ daily closes above $86.00 with follow-through toward $90+ while holding above EMA50 (~$82.26)
Daily close below $80.40 (SMA50 area) followed by a break under $79.40 (EMA100) would shift bias back bearish
Start near SMA50/EMA50 support; add on EMA100/SMA100 retest; heavy add only on deeper fib-style retrace into EMA200/SMA200 zone (~$72) where trend support is strongest.
Trim into prior swing-high supply ($90-$92) then into extension/overhead resistance ($95-$98); close if price becomes extremely stretched into round-number/$100+ extension versus the MA stack.
As of May 22, 2026, COPX (Global X Copper Miners ETF) is in a choppy range state on the daily chart with 66% confidence. Price ~$83.36 is grinding sideways-to-up after a sharp rebound, holding above clustered mid-MAs (SMA50/100/EMA50) with RSI ~50; prior swing high near ~$90+ still overhead.
On the daily timeframe, COPX has key support at $80.4 and key resistance at $86.0. The most likely scenario (bullish) targets $86.0 and $92.0, with a revert level at $83.0.
COPX (Global X Copper Miners ETF) is currently classified as choppy range on the daily chart, with 66% confidence. Confirmation requires: 2+ daily closes above $86.00 with follow-through toward $90+ while holding above EMA50 (~$82.26) This would be invalidated by: Daily close below $80.40 (SMA50 area) followed by a break under $79.40 (EMA100) would shift bias back bearish
The most likely scenario (bullish) targets $86.0 and $92.0, with a revert level at $83.0. The alternative scenario (bearish) targets $79.4 and $72.0.
Multi-layer AI agents analyse 200+ stocks across daily, weekly, and monthly timeframes — producing market state classifications, price scenarios with targets, and position entry/exit levels. Daily charts updated every trading day at 6 PM ET. Weekly charts refresh Fridays. Monthly charts refresh on the last trading day of each month. No paywall. No sign-up required.
Built by Foliotrail.
All content on this website — including charts, analysis, price targets, support/resistance levels, and position zones — is generated entirely by AI and provided for educational and informational purposes only.
This is not financial advice. NEXUSNOIR VENTURES SL (the operator of this website) is not a registered investment adviser or broker-dealer. You should not make investment decisions based solely on this information. Always do your own research and consult a qualified financial advisor.
By continuing, you acknowledge that you have read and agree to our full disclaimer & terms of use and privacy policy.