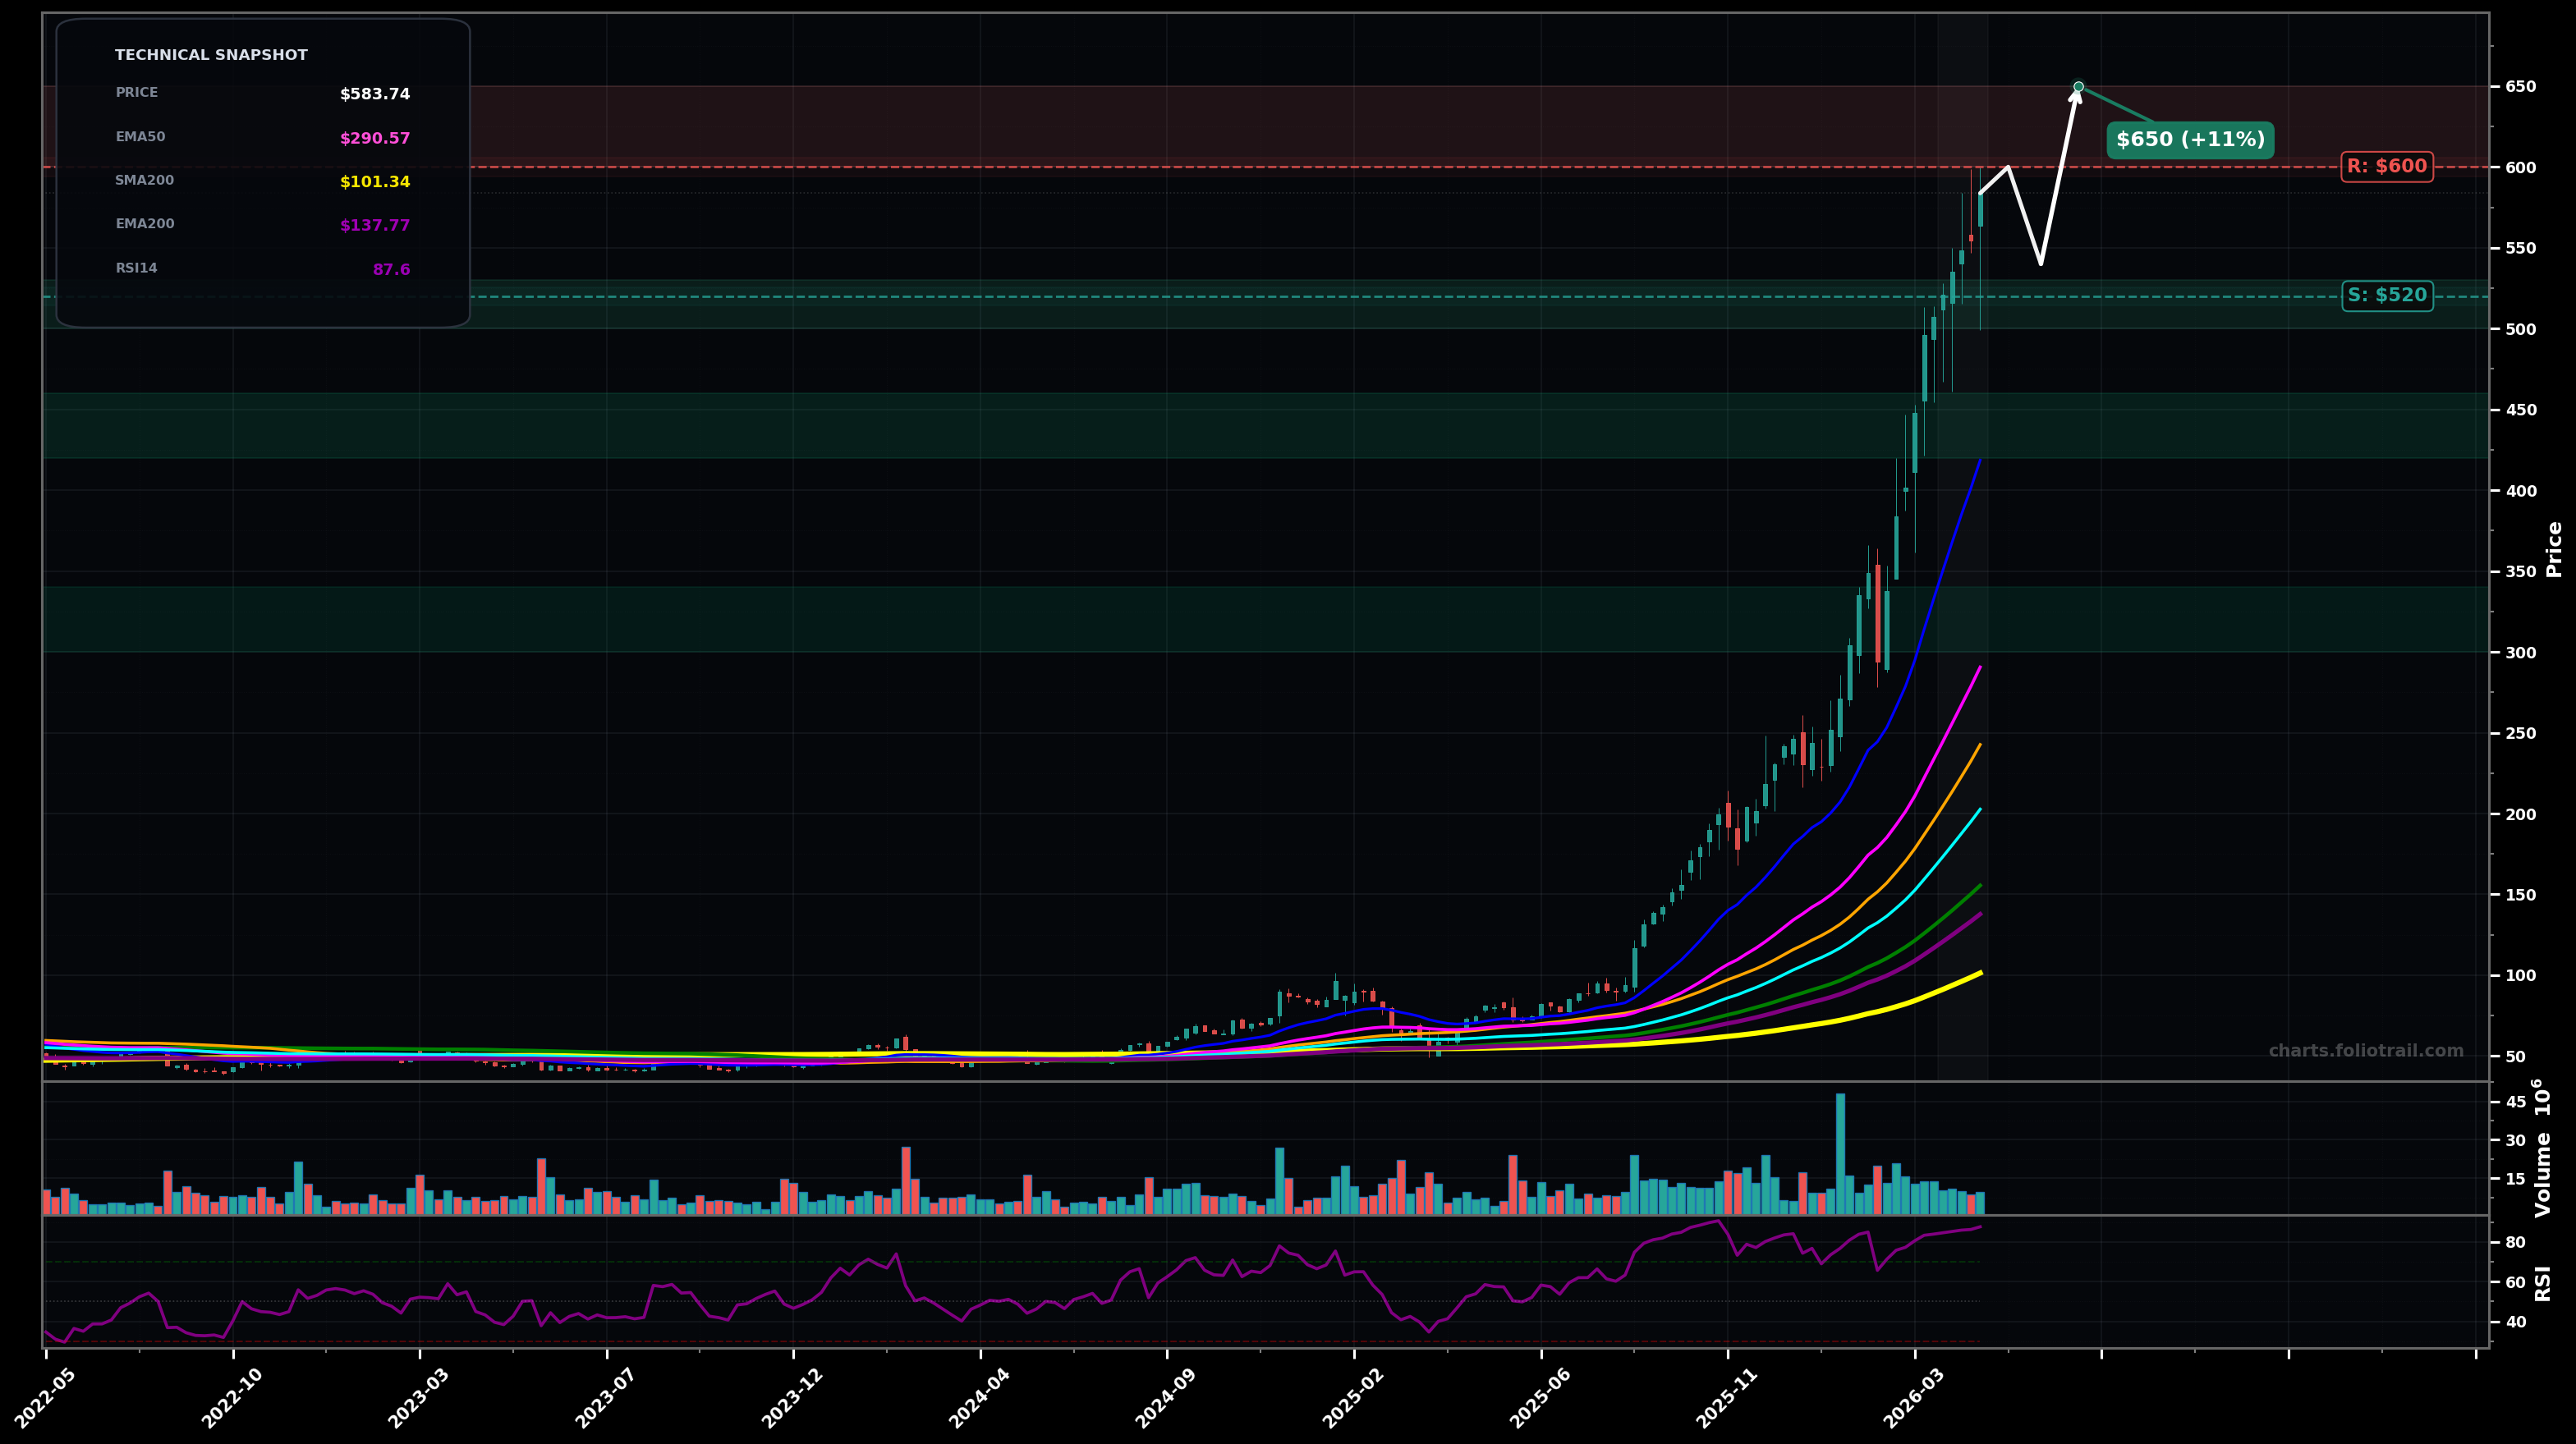
As of May 22, 2026, CIEN (Ciena Corporation) is in a parabolic state on the weekly chart, with a confidence level of 76%. Key support is at $520 and key resistance at $600. Vertical HH/HL advance into new highs; price ($583.74) extremely extended above all key MAs with RSI-14 ~87.6 (overbought).
Parabolic continuation (Elliott: late Wave 5 extension) with brief consolidation, then one more push higher before a larger mean-reversion pullback.
Blow-off top then sharp mean-reversion (Elliott: Wave 5 terminates; ABC correction toward rising averages / prior breakout shelf).
Weekly close above $600 with continued HH/HL (no loss of the prior week low).
Weekly close below $520 (loss of the most recent swing low support zone).
Prefer buying on mean-reversion: $500–$530 = first major breakout/near-term swing support; $420–$460 = deeper fib-like retrace zone; $300–$340 = EMA50 (pink ~$290) area for a higher-quality reset if the parabola unwinds.
Price is massively stretched vs EMA50/100/200 (momentum blow-off risk); trim into extensions ($600+), more aggressively on further vertical push ($650+), and consider full exit if a true mania extension prints ($750+).
As of May 22, 2026, CIEN (Ciena Corporation) is in a parabolic state on the weekly chart with 76% confidence. Vertical HH/HL advance into new highs; price ($583.74) extremely extended above all key MAs with RSI-14 ~87.6 (overbought).
On the weekly timeframe, CIEN has key support at $520 and key resistance at $600. The most likely scenario (bullish) targets $600 and $650, with a revert level at $540.
CIEN (Ciena Corporation) is currently classified as parabolic on the weekly chart, with 76% confidence. Confirmation requires: Weekly close above $600 with continued HH/HL (no loss of the prior week low). This would be invalidated by: Weekly close below $520 (loss of the most recent swing low support zone).
The most likely scenario (bullish) targets $600 and $650, with a revert level at $540. The alternative scenario (bearish) targets $520 and $420.
Multi-layer AI agents analyse 200+ stocks across daily, weekly, and monthly timeframes — producing market state classifications, price scenarios with targets, and position entry/exit levels. Daily charts updated every trading day at 6 PM ET. Weekly charts refresh Fridays. Monthly charts refresh on the last trading day of each month. No paywall. No sign-up required.
Built by Foliotrail.
All content on this website — including charts, analysis, price targets, support/resistance levels, and position zones — is generated entirely by AI and provided for educational and informational purposes only.
This is not financial advice. NEXUSNOIR VENTURES SL (the operator of this website) is not a registered investment adviser or broker-dealer. You should not make investment decisions based solely on this information. Always do your own research and consult a qualified financial advisor.
By continuing, you acknowledge that you have read and agree to our full disclaimer & terms of use and privacy policy.