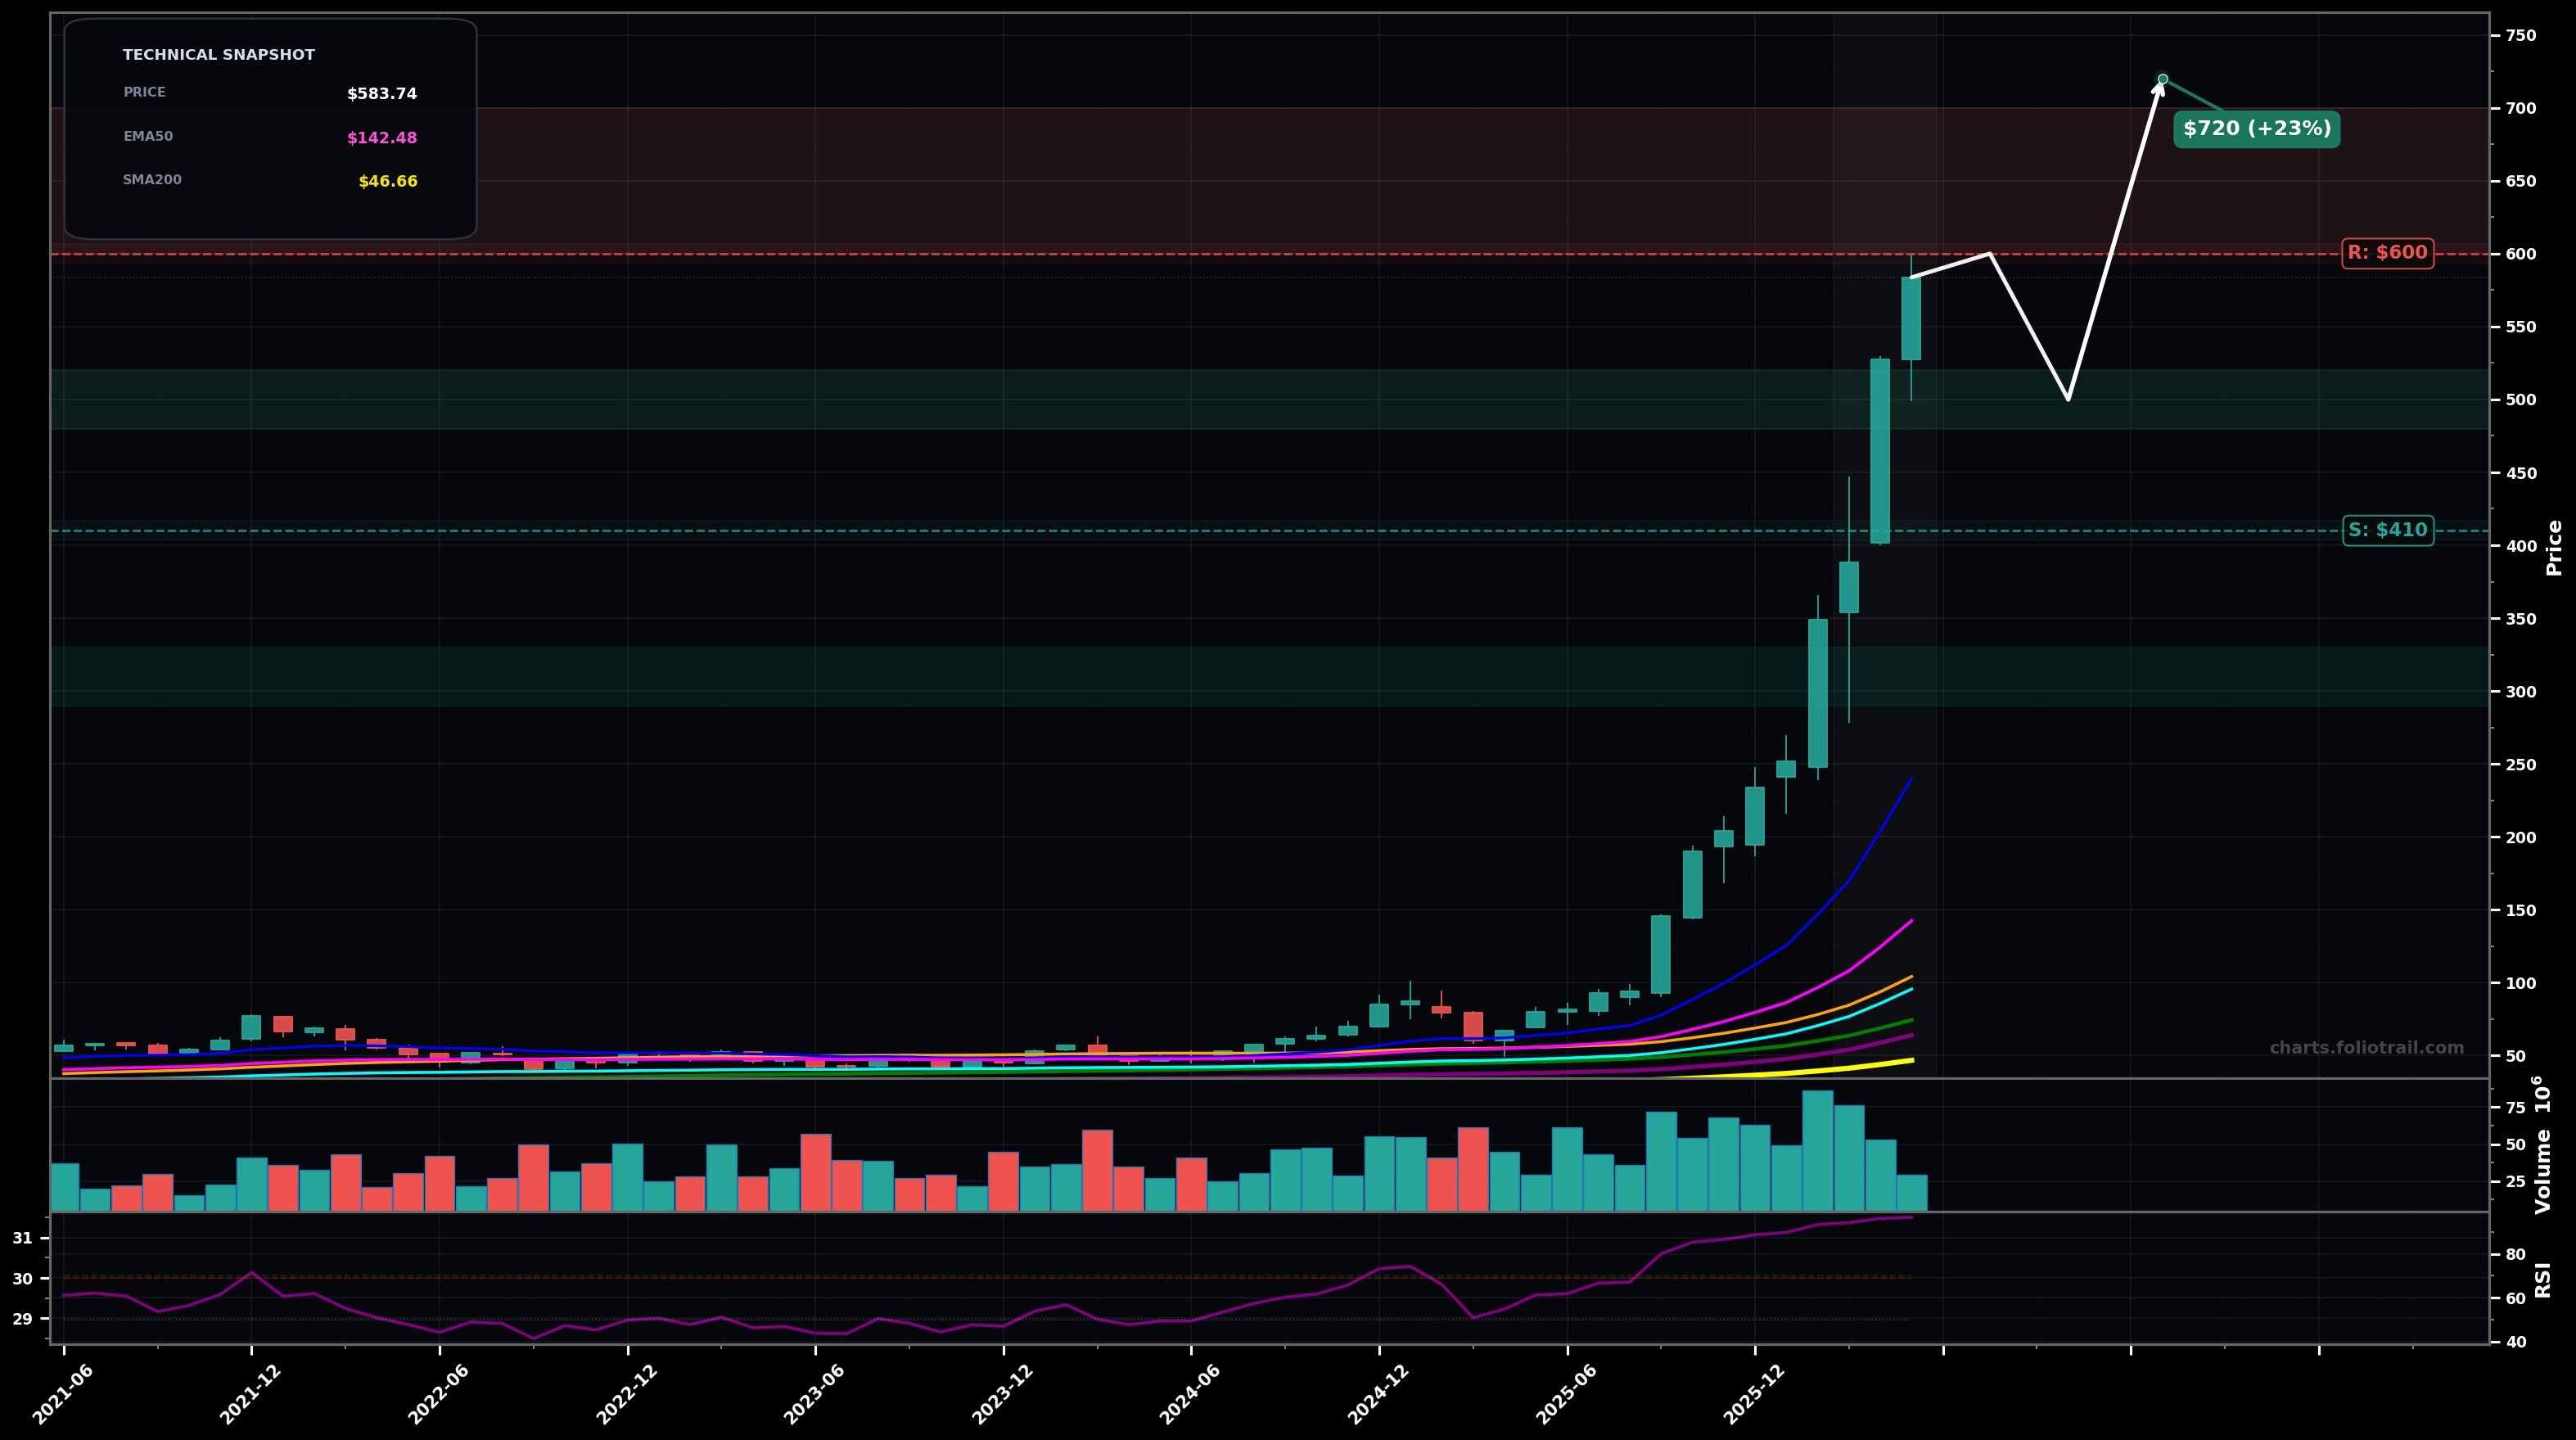
As of May 22, 2026, CIEN (Ciena Corporation) is in a parabolic state on the monthly chart, with a confidence level of 82%. Key support is at $410 and key resistance at $600. Monthly price is in a near-vertical impulse to new highs; last candles show strong expansion with RSI extremely overbought (~96) and price far above all major MAs.
Bullish continuation but with a high chance of a sharp pullback first; price chops/pulls into the $520–$480 zone then attempts another leg higher (Elliott: extended wave 3 with a wave 4 pullback before wave 5).
Parabolic unwind/mean reversion: failure near $600 leads to a faster drop toward the prior breakout shelf and rising EMA20 area, with risk of an overshoot to the psychological/round-number zones (Elliott: wave 4 turns into deeper ABC).
Monthly close holding above $520 keeps parabolic advance intact
Monthly close below $410 would signal a parabolic break and likely deeper mean-reversion
Buy zones are set at likely wave-4 / post-parabolic mean-reversion areas: prior breakout shelf ($480–$520), then deeper support near $410, then worst-case ABC flush toward $300 round-number support.
Trim into strength because price is extremely stretched vs EMA50/EMA100 and RSI is extreme; higher zones reflect potential wave-5 blow-off extensions before a larger cycle correction.
As of May 22, 2026, CIEN (Ciena Corporation) is in a parabolic state on the monthly chart with 82% confidence. Monthly price is in a near-vertical impulse to new highs; last candles show strong expansion with RSI extremely overbought (~96) and price far above all major MAs.
On the monthly timeframe, CIEN has key support at $410 and key resistance at $600. The most likely scenario (bullish) targets $600 and $720, with a revert level at $500.
CIEN (Ciena Corporation) is currently classified as parabolic on the monthly chart, with 82% confidence. Confirmation requires: Monthly close holding above $520 keeps parabolic advance intact This would be invalidated by: Monthly close below $410 would signal a parabolic break and likely deeper mean-reversion
The most likely scenario (bullish) targets $600 and $720, with a revert level at $500. The alternative scenario (bearish) targets $410 and $300.
Multi-layer AI agents analyse 200+ stocks across daily, weekly, and monthly timeframes — producing market state classifications, price scenarios with targets, and position entry/exit levels. Daily charts updated every trading day at 6 PM ET. Weekly charts refresh Fridays. Monthly charts refresh on the last trading day of each month. No paywall. No sign-up required.
Built by Foliotrail.
All content on this website — including charts, analysis, price targets, support/resistance levels, and position zones — is generated entirely by AI and provided for educational and informational purposes only.
This is not financial advice. NEXUSNOIR VENTURES SL (the operator of this website) is not a registered investment adviser or broker-dealer. You should not make investment decisions based solely on this information. Always do your own research and consult a qualified financial advisor.
By continuing, you acknowledge that you have read and agree to our full disclaimer & terms of use and privacy policy.