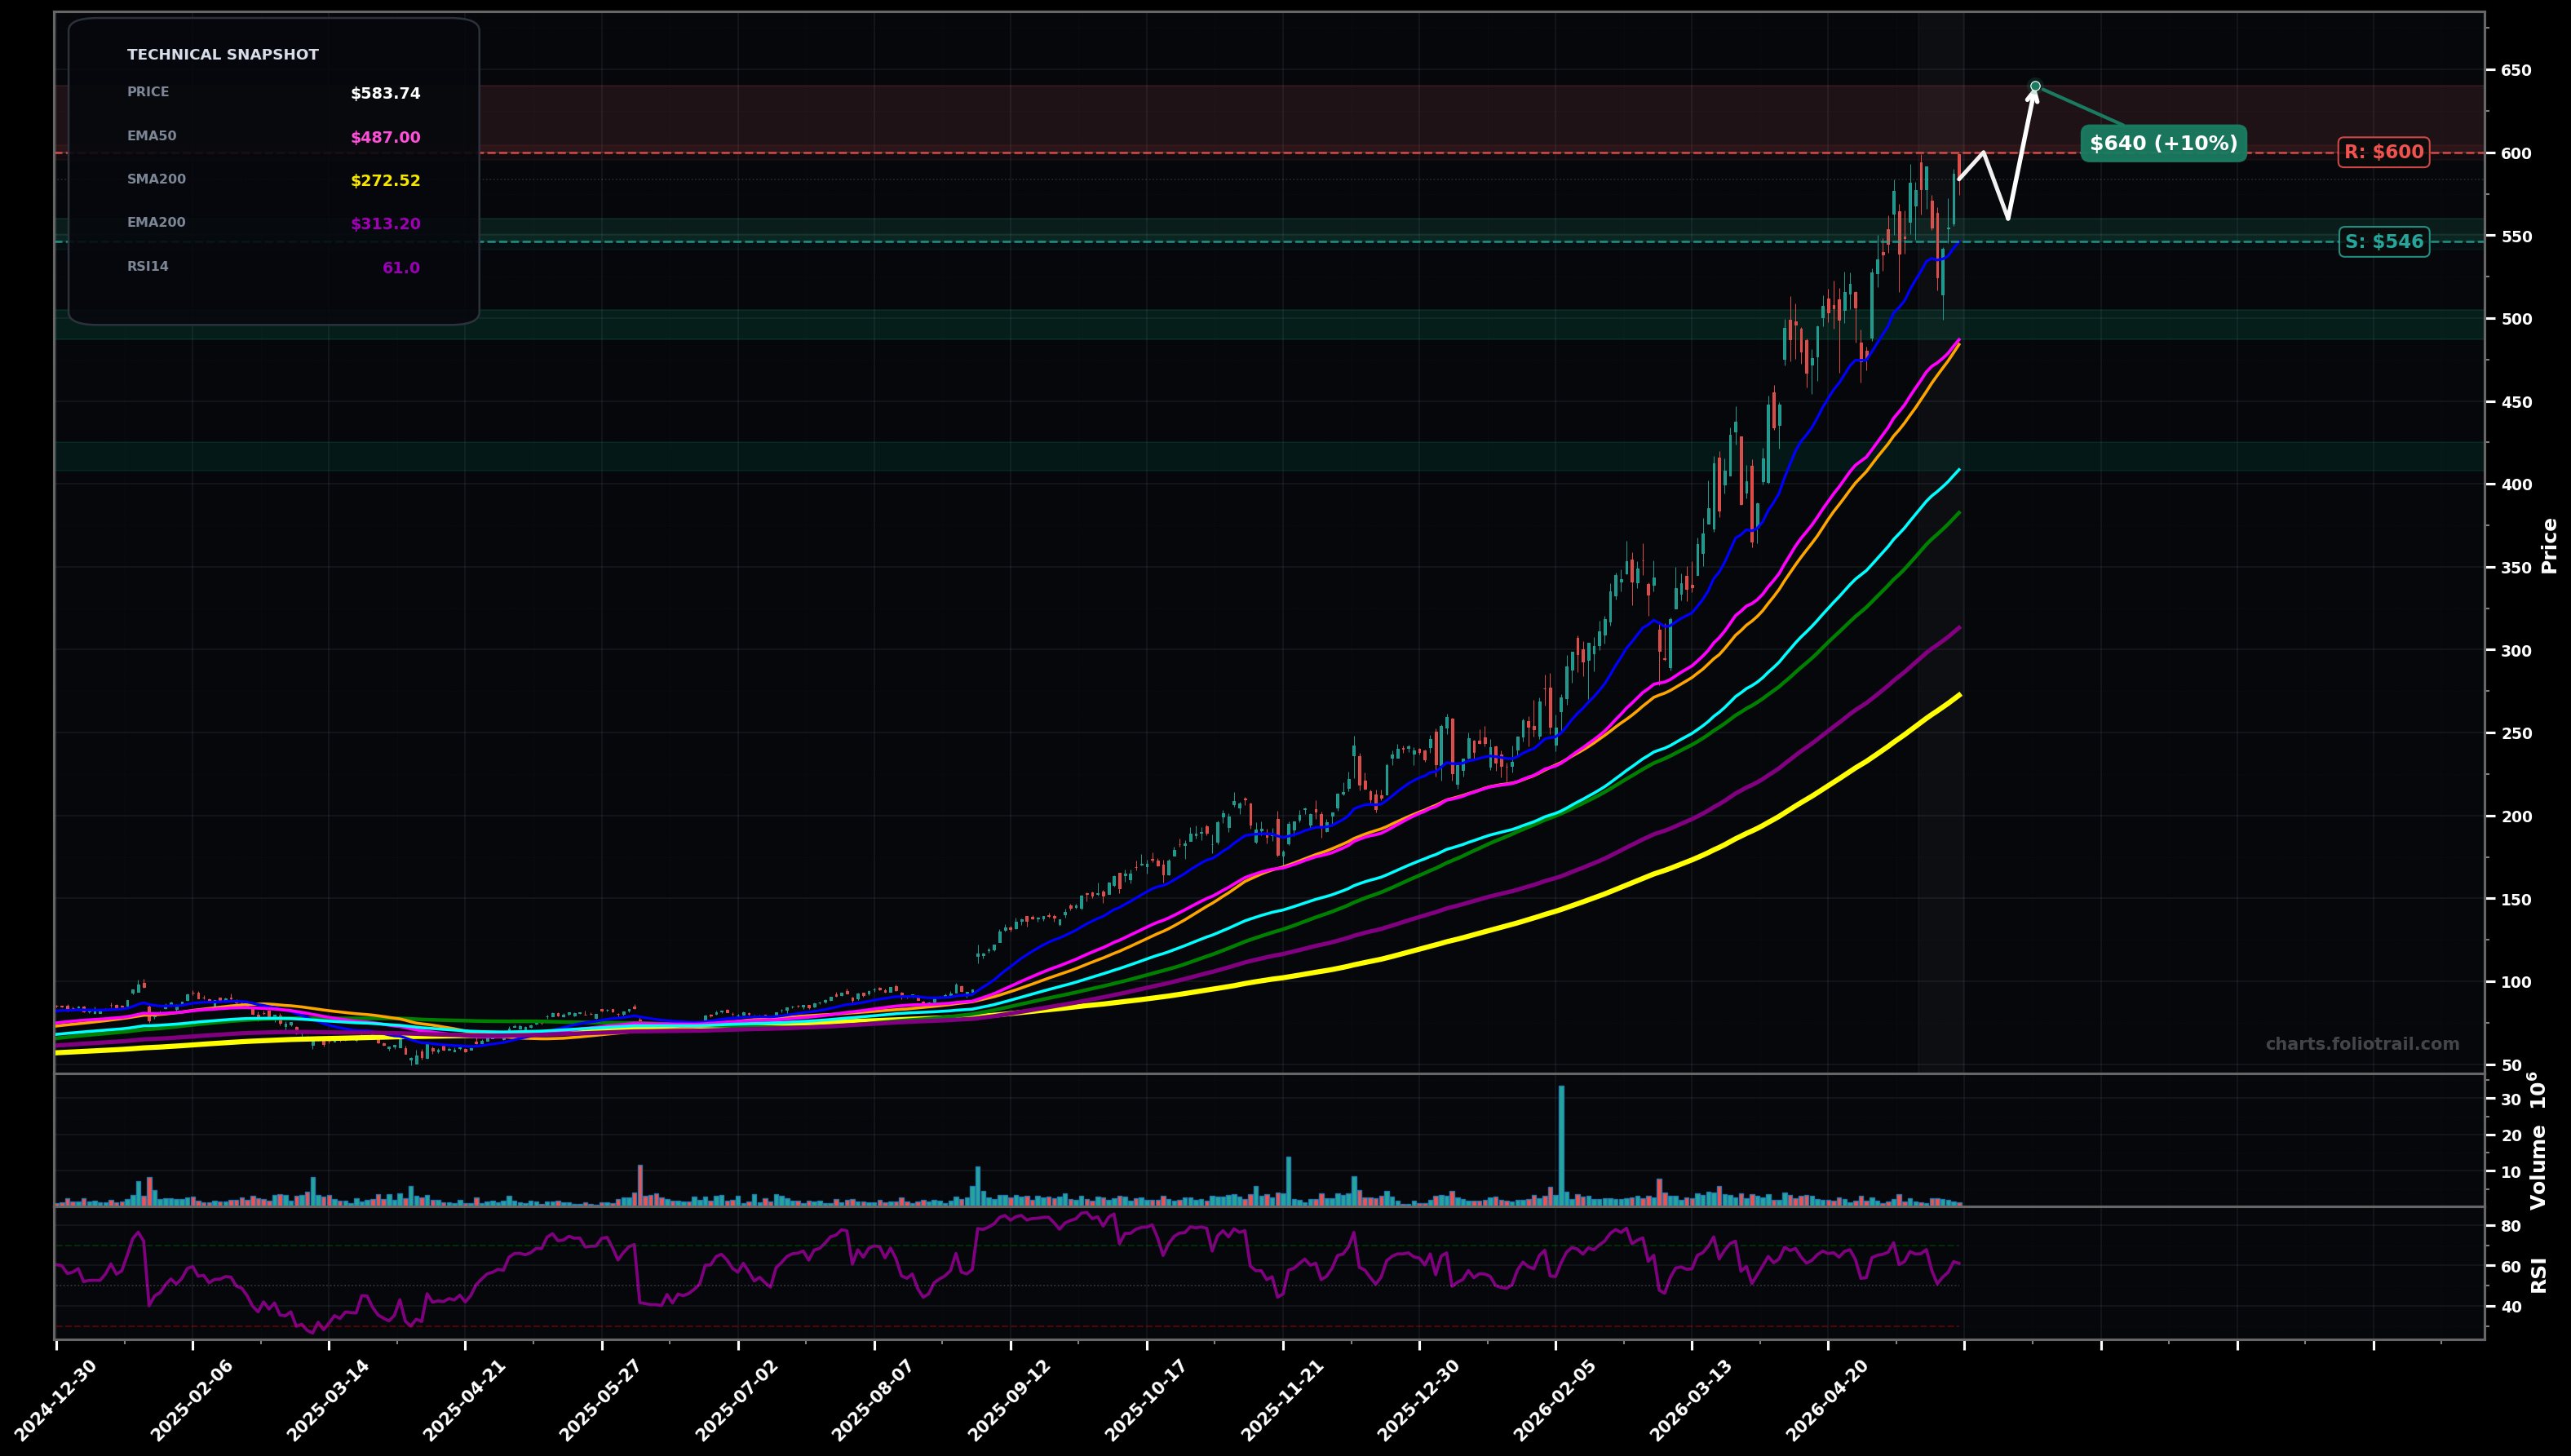
As of May 22, 2026, CIEN (Ciena Corporation) is in a uptrend state on the daily chart, with a confidence level of 78%. Key support is at $546 and key resistance at $600. Price at ~$583.74 is making fresh highs with a tight consolidation just under ~$600; trend remains strongly above all key MAs, RSI ~61 (not extreme).
Bullish continuation: price digests under $600 then breaks out, with a measured push toward the next round-number/extension zone; Elliott wave view = late impulse (wave 5) or wave 3 extension with shallow wave-4 style pauses; fib extension from the last swing base suggests continuation if $546 holds.
Deeper pullback/consolidation: rejection near $600 triggers a larger wave-4 type correction toward the rising EMA50/SMA50 cluster; still constructive if it forms a higher low and reclaims $560 quickly (fib retrace likely 23.6%–38.2% of the last leg).
2+ daily closes above $600 holding above $590
Daily close below $546 (EMA20) followed by a lower low under $520
Scale at rising dynamic support: EMA20 first ($546–$560), then EMA50/SMA50 confluence ($487–$505), then EMA100 area ($408–$425) if a wave-4 style correction deepens but trend remains intact.
Trim into strength at psychological/extension zones: first into breakout ($600–$640), more if price accelerates and stretches far above EMA50 ($640–$700), and consider full exit if a parabolic extension occurs ($700–$780) due to elevated reversal risk.
As of May 22, 2026, CIEN (Ciena Corporation) is in a uptrend state on the daily chart with 78% confidence. Price at ~$583.74 is making fresh highs with a tight consolidation just under ~$600; trend remains strongly above all key MAs, RSI ~61 (not extreme).
On the daily timeframe, CIEN has key support at $546 and key resistance at $600. The most likely scenario (bullish) targets $600 and $640, with a revert level at $560.
CIEN (Ciena Corporation) is currently classified as uptrend on the daily chart, with 78% confidence. Confirmation requires: 2+ daily closes above $600 holding above $590 This would be invalidated by: Daily close below $546 (EMA20) followed by a lower low under $520
The most likely scenario (bullish) targets $600 and $640, with a revert level at $560. The alternative scenario (bearish) targets $546 and $487.
Multi-layer AI agents analyse 200+ stocks across daily, weekly, and monthly timeframes — producing market state classifications, price scenarios with targets, and position entry/exit levels. Daily charts updated every trading day at 6 PM ET. Weekly charts refresh Fridays. Monthly charts refresh on the last trading day of each month. No paywall. No sign-up required.
Built by Foliotrail.
All content on this website — including charts, analysis, price targets, support/resistance levels, and position zones — is generated entirely by AI and provided for educational and informational purposes only.
This is not financial advice. NEXUSNOIR VENTURES SL (the operator of this website) is not a registered investment adviser or broker-dealer. You should not make investment decisions based solely on this information. Always do your own research and consult a qualified financial advisor.
By continuing, you acknowledge that you have read and agree to our full disclaimer & terms of use and privacy policy.