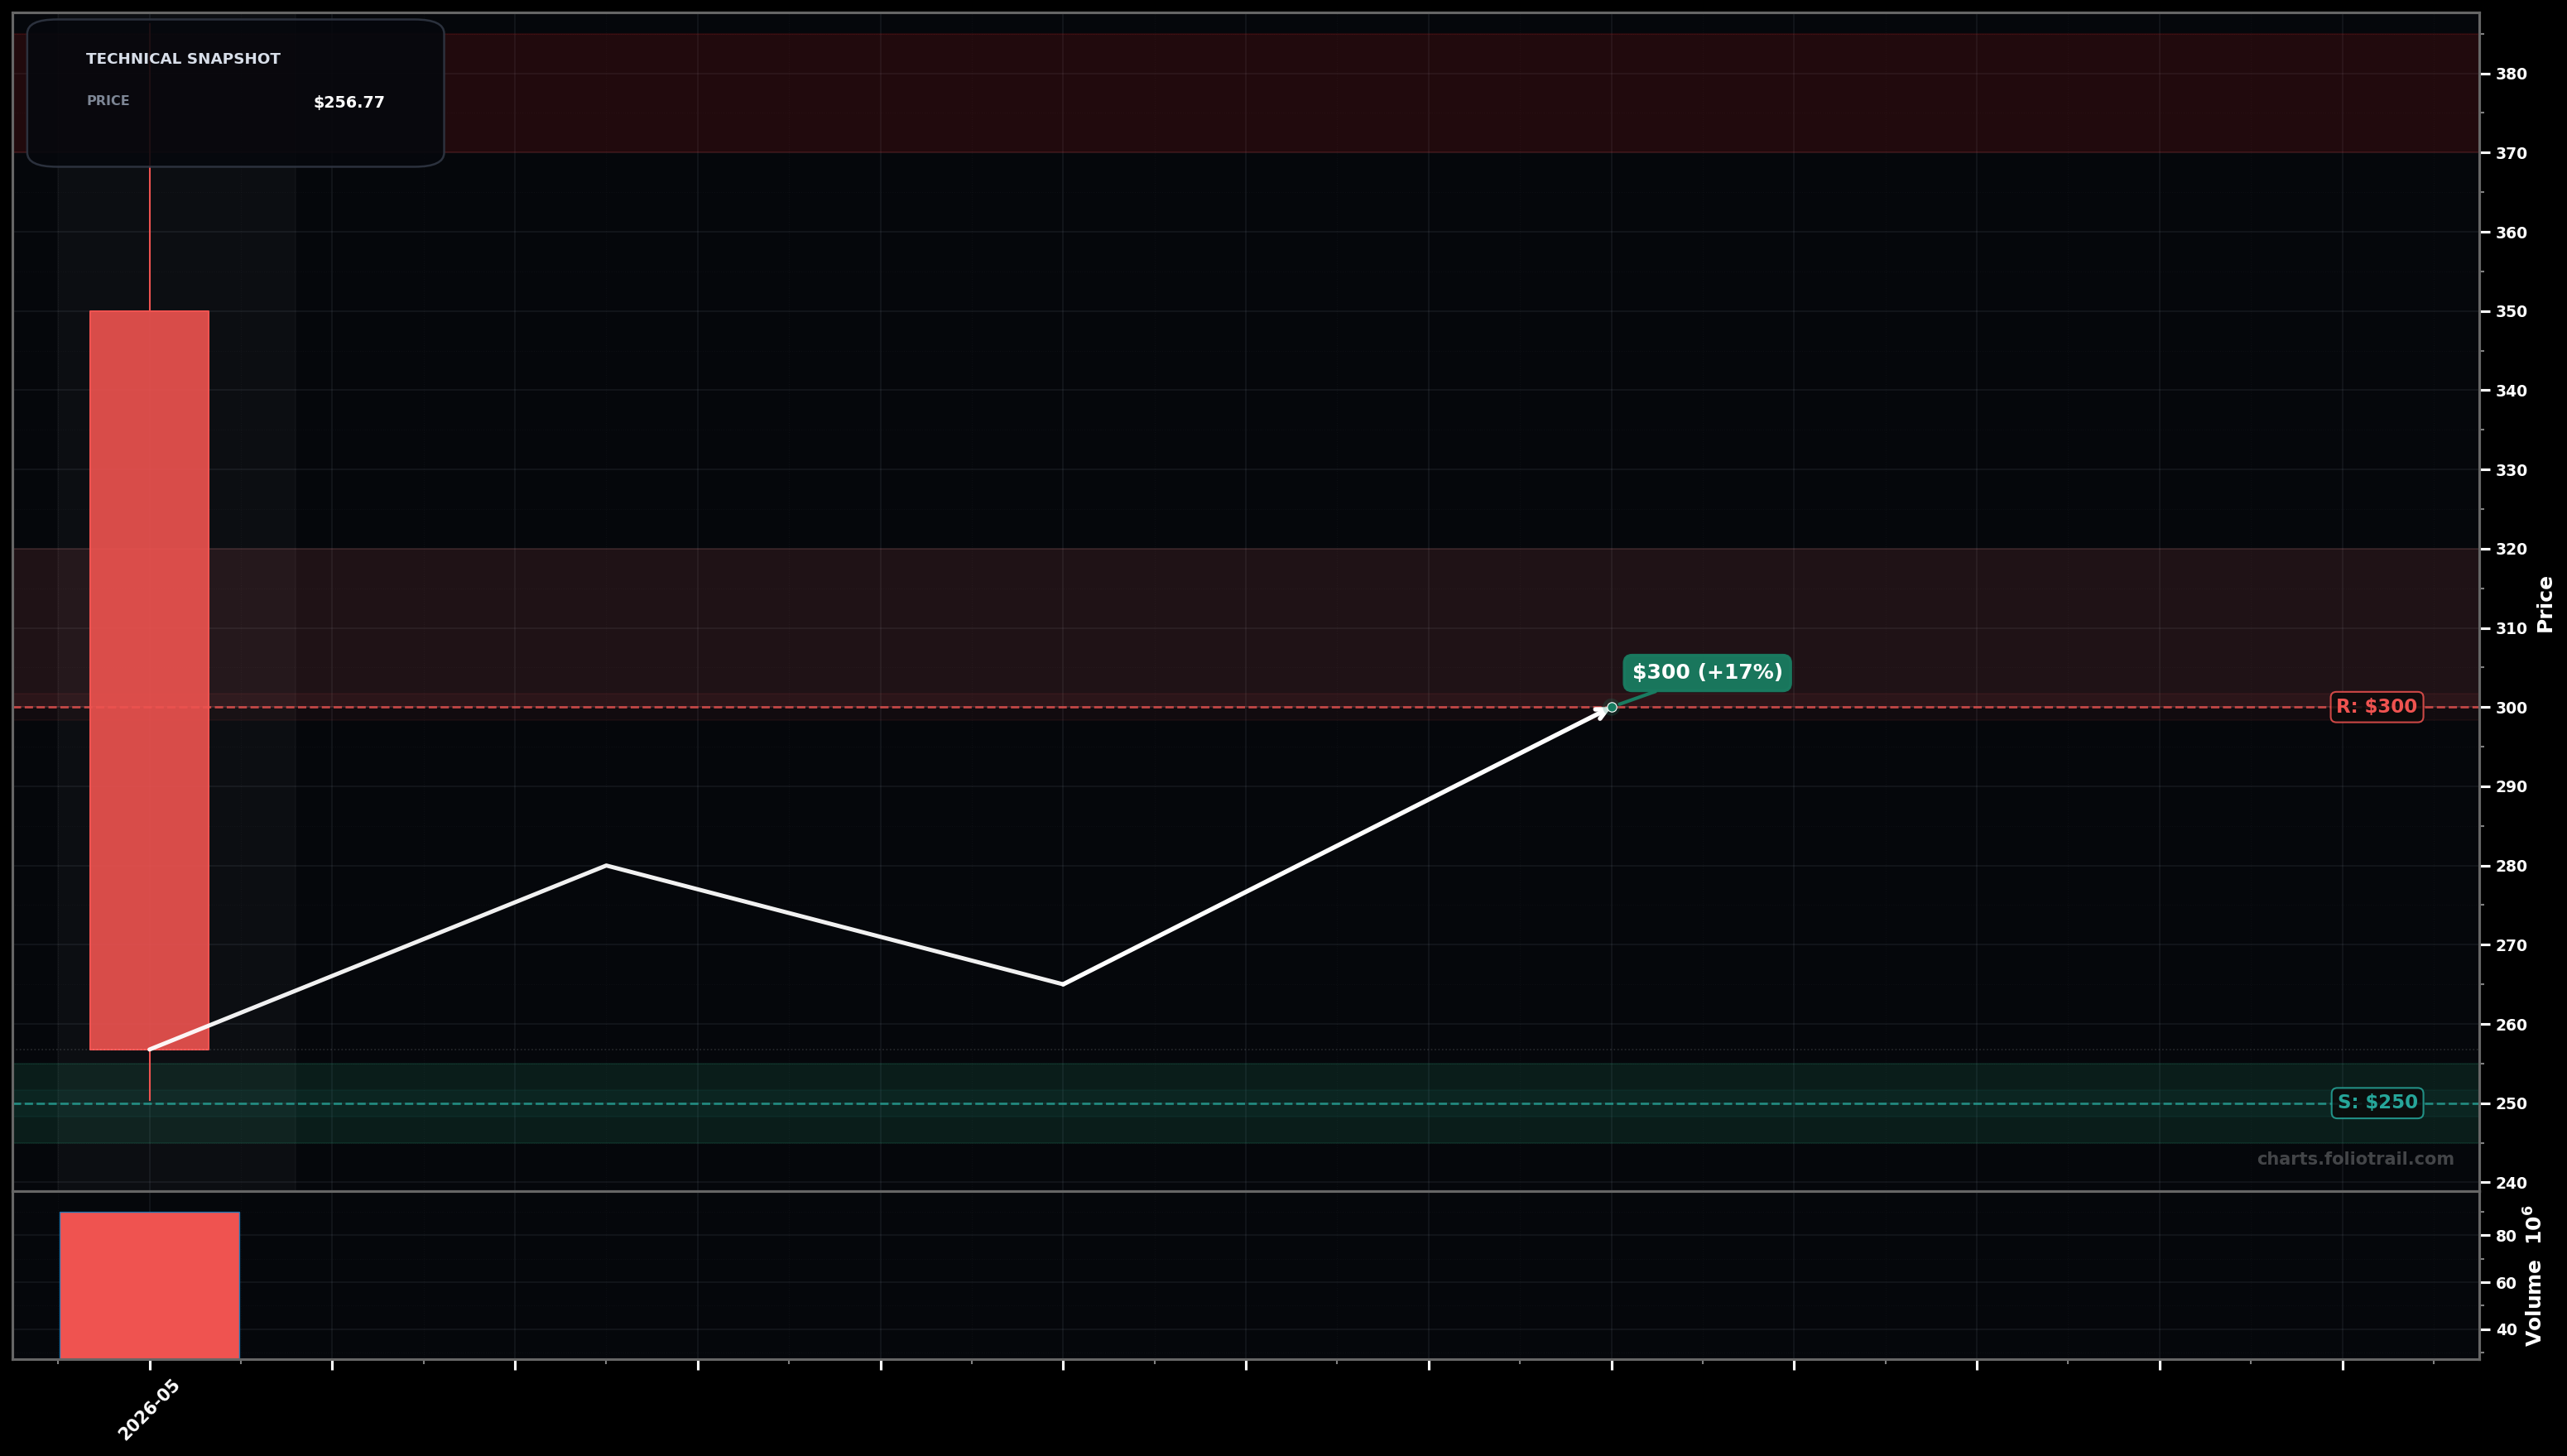
As of May 22, 2026, CBRS (Cerebras Systems Inc.) is in a falling knife state on the monthly chart, with a confidence level of 74%. Key support is at $250 and key resistance at $300. Monthly printed a very large red candle with close near lows and expanded range/volume; price now around $256.77 after a sharp selloff from the $350 area.
Base-building attempt: price holds the $250 area (swing-low zone) and mean-reverts upward toward prior breakdown area; likely an A-B-C style bounce inside a larger corrective structure (Elliott: potential Wave A down completed, Wave B rebound underway).
Continuation lower: $250 fails and price flushes into the next demand pocket; Elliott: the current impulse down extends (Wave 3/5 type extension) before any durable base forms.
Another monthly close below $250.00
Monthly close back above $300.00
Scale near the $250 swing-low reference; add on a controlled breakdown/retest into $230s; heavy add only on capitulation into low-$220s where risk/reward improves.
Trim into the prior breakdown/overhead supply zones ($300s) and exit into a full mean-reversion back toward prior highs ($370+), where long-term forward returns typically compress after sharp V-rebounds.
As of May 22, 2026, CBRS (Cerebras Systems Inc.) is in a falling knife state on the monthly chart with 74% confidence. Monthly printed a very large red candle with close near lows and expanded range/volume; price now around $256.77 after a sharp selloff from the $350 area.
On the monthly timeframe, CBRS has key support at $250 and key resistance at $300. The most likely scenario (bullish) targets $280 and $300, with a revert level at $265.
CBRS (Cerebras Systems Inc.) is currently classified as falling knife on the monthly chart, with 74% confidence. Confirmation requires: Another monthly close below $250.00 This would be invalidated by: Monthly close back above $300.00
The most likely scenario (bullish) targets $280 and $300, with a revert level at $265. The alternative scenario (bearish) targets $235 and $220.
Multi-layer AI agents analyse 200+ stocks across daily, weekly, and monthly timeframes — producing market state classifications, price scenarios with targets, and position entry/exit levels. Daily charts updated every trading day at 6 PM ET. Weekly charts refresh Fridays. Monthly charts refresh on the last trading day of each month. No paywall. No sign-up required.
Built by Foliotrail.
All content on this website — including charts, analysis, price targets, support/resistance levels, and position zones — is generated entirely by AI and provided for educational and informational purposes only.
This is not financial advice. NEXUSNOIR VENTURES SL (the operator of this website) is not a registered investment adviser or broker-dealer. You should not make investment decisions based solely on this information. Always do your own research and consult a qualified financial advisor.
By continuing, you acknowledge that you have read and agree to our full disclaimer & terms of use and privacy policy.