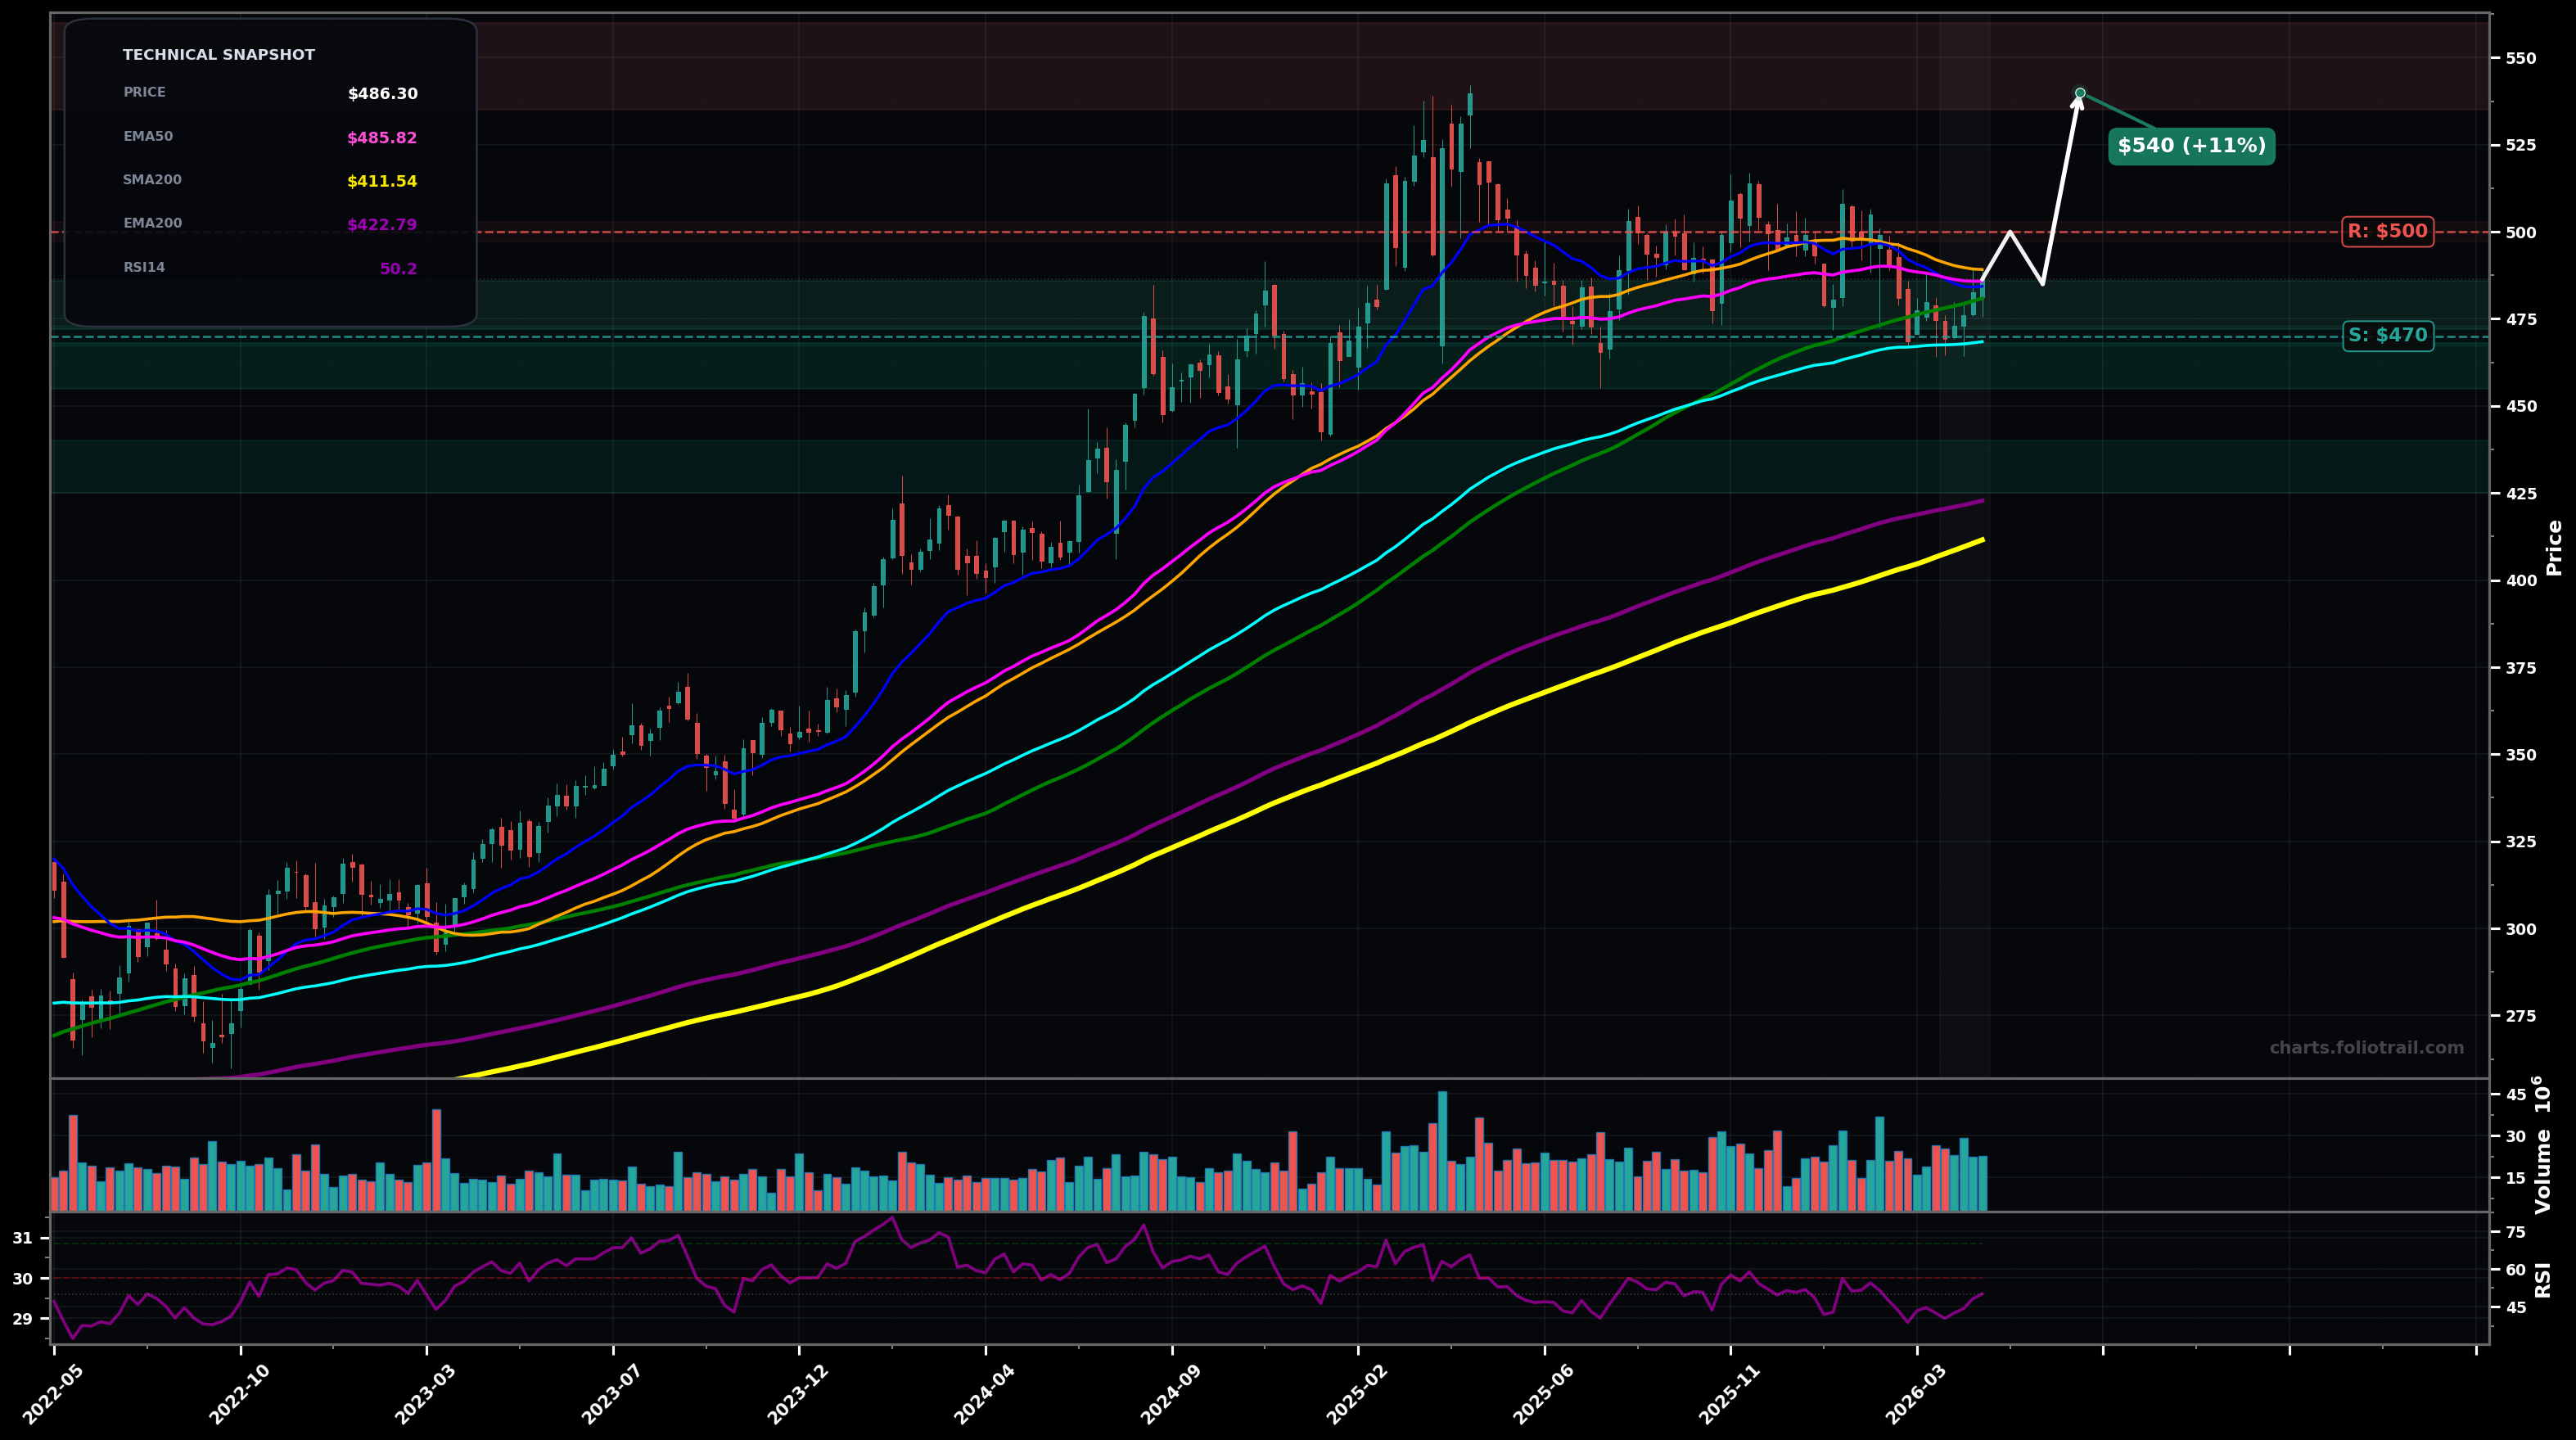
As of May 22, 2026, BRK.B (Berkshire Hathaway Inc. Class B) is in a choppy range state on the weekly chart, with a confidence level of 67%. Key support is at $470 and key resistance at $500. Weekly BRK.B is consolidating after the prior impulse to ~$540, with price ~$486.30 sitting below SMA50 ($489.16) and SMA100 ($480.86) but holding above rising EMA100 ($468.45); RSI ~50 shows neutral momentum.
Range resolves upward: hold the ~$470-$475 swing-low area, reclaim SMA50/EMA50, then push through the ~$500 supply zone; likely a Wave (4) consolidation finishing and starting Wave (5) toward prior highs.
Range breaks down: failure to hold ~$470 (near EMA100) triggers a deeper pullback toward the rising long-term trend guides (SMA100/EMA100 zone already lost, then drift to EMA200/SMA200 confluence over time).
2 weekly closes above $500 would confirm a breakout attempt from the range
A weekly close below $468 would invalidate the range/bullish-bias base and shift focus to deeper support tests
Start near range midline/reclaim of EMA50; add on breakdown-test of EMA100/structure; heavy add only on deeper mean-reversion toward EMA200/SMA200 while long-term uptrend structure remains intact.
Trim into a breakout extension above prior highs (Wave (5) risk) and progressively de-risk on increasingly stretched moves vs the rising long MAs; close only on extreme multi-year overextension.
As of May 22, 2026, BRK.B (Berkshire Hathaway Inc. Class B) is in a choppy range state on the weekly chart with 67% confidence. Weekly BRK.B is consolidating after the prior impulse to ~$540, with price ~$486.30 sitting below SMA50 ($489.16) and SMA100 ($480.86) but holding above rising EMA100 ($468.45); RSI ~50 shows neutral momentum.
On the weekly timeframe, BRK.B has key support at $470 and key resistance at $500. The most likely scenario (bullish) targets $500 and $540, with a revert level at $485.
BRK.B (Berkshire Hathaway Inc. Class B) is currently classified as choppy range on the weekly chart, with 67% confidence. Confirmation requires: 2 weekly closes above $500 would confirm a breakout attempt from the range This would be invalidated by: A weekly close below $468 would invalidate the range/bullish-bias base and shift focus to deeper support tests
The most likely scenario (bullish) targets $500 and $540, with a revert level at $485. The alternative scenario (bearish) targets $455 and $425.
Multi-layer AI agents analyse 200+ stocks across daily, weekly, and monthly timeframes — producing market state classifications, price scenarios with targets, and position entry/exit levels. Daily charts updated every trading day at 6 PM ET. Weekly charts refresh Fridays. Monthly charts refresh on the last trading day of each month. No paywall. No sign-up required.
Built by Foliotrail.
All content on this website — including charts, analysis, price targets, support/resistance levels, and position zones — is generated entirely by AI and provided for educational and informational purposes only.
This is not financial advice. NEXUSNOIR VENTURES SL (the operator of this website) is not a registered investment adviser or broker-dealer. You should not make investment decisions based solely on this information. Always do your own research and consult a qualified financial advisor.
By continuing, you acknowledge that you have read and agree to our full disclaimer & terms of use and privacy policy.