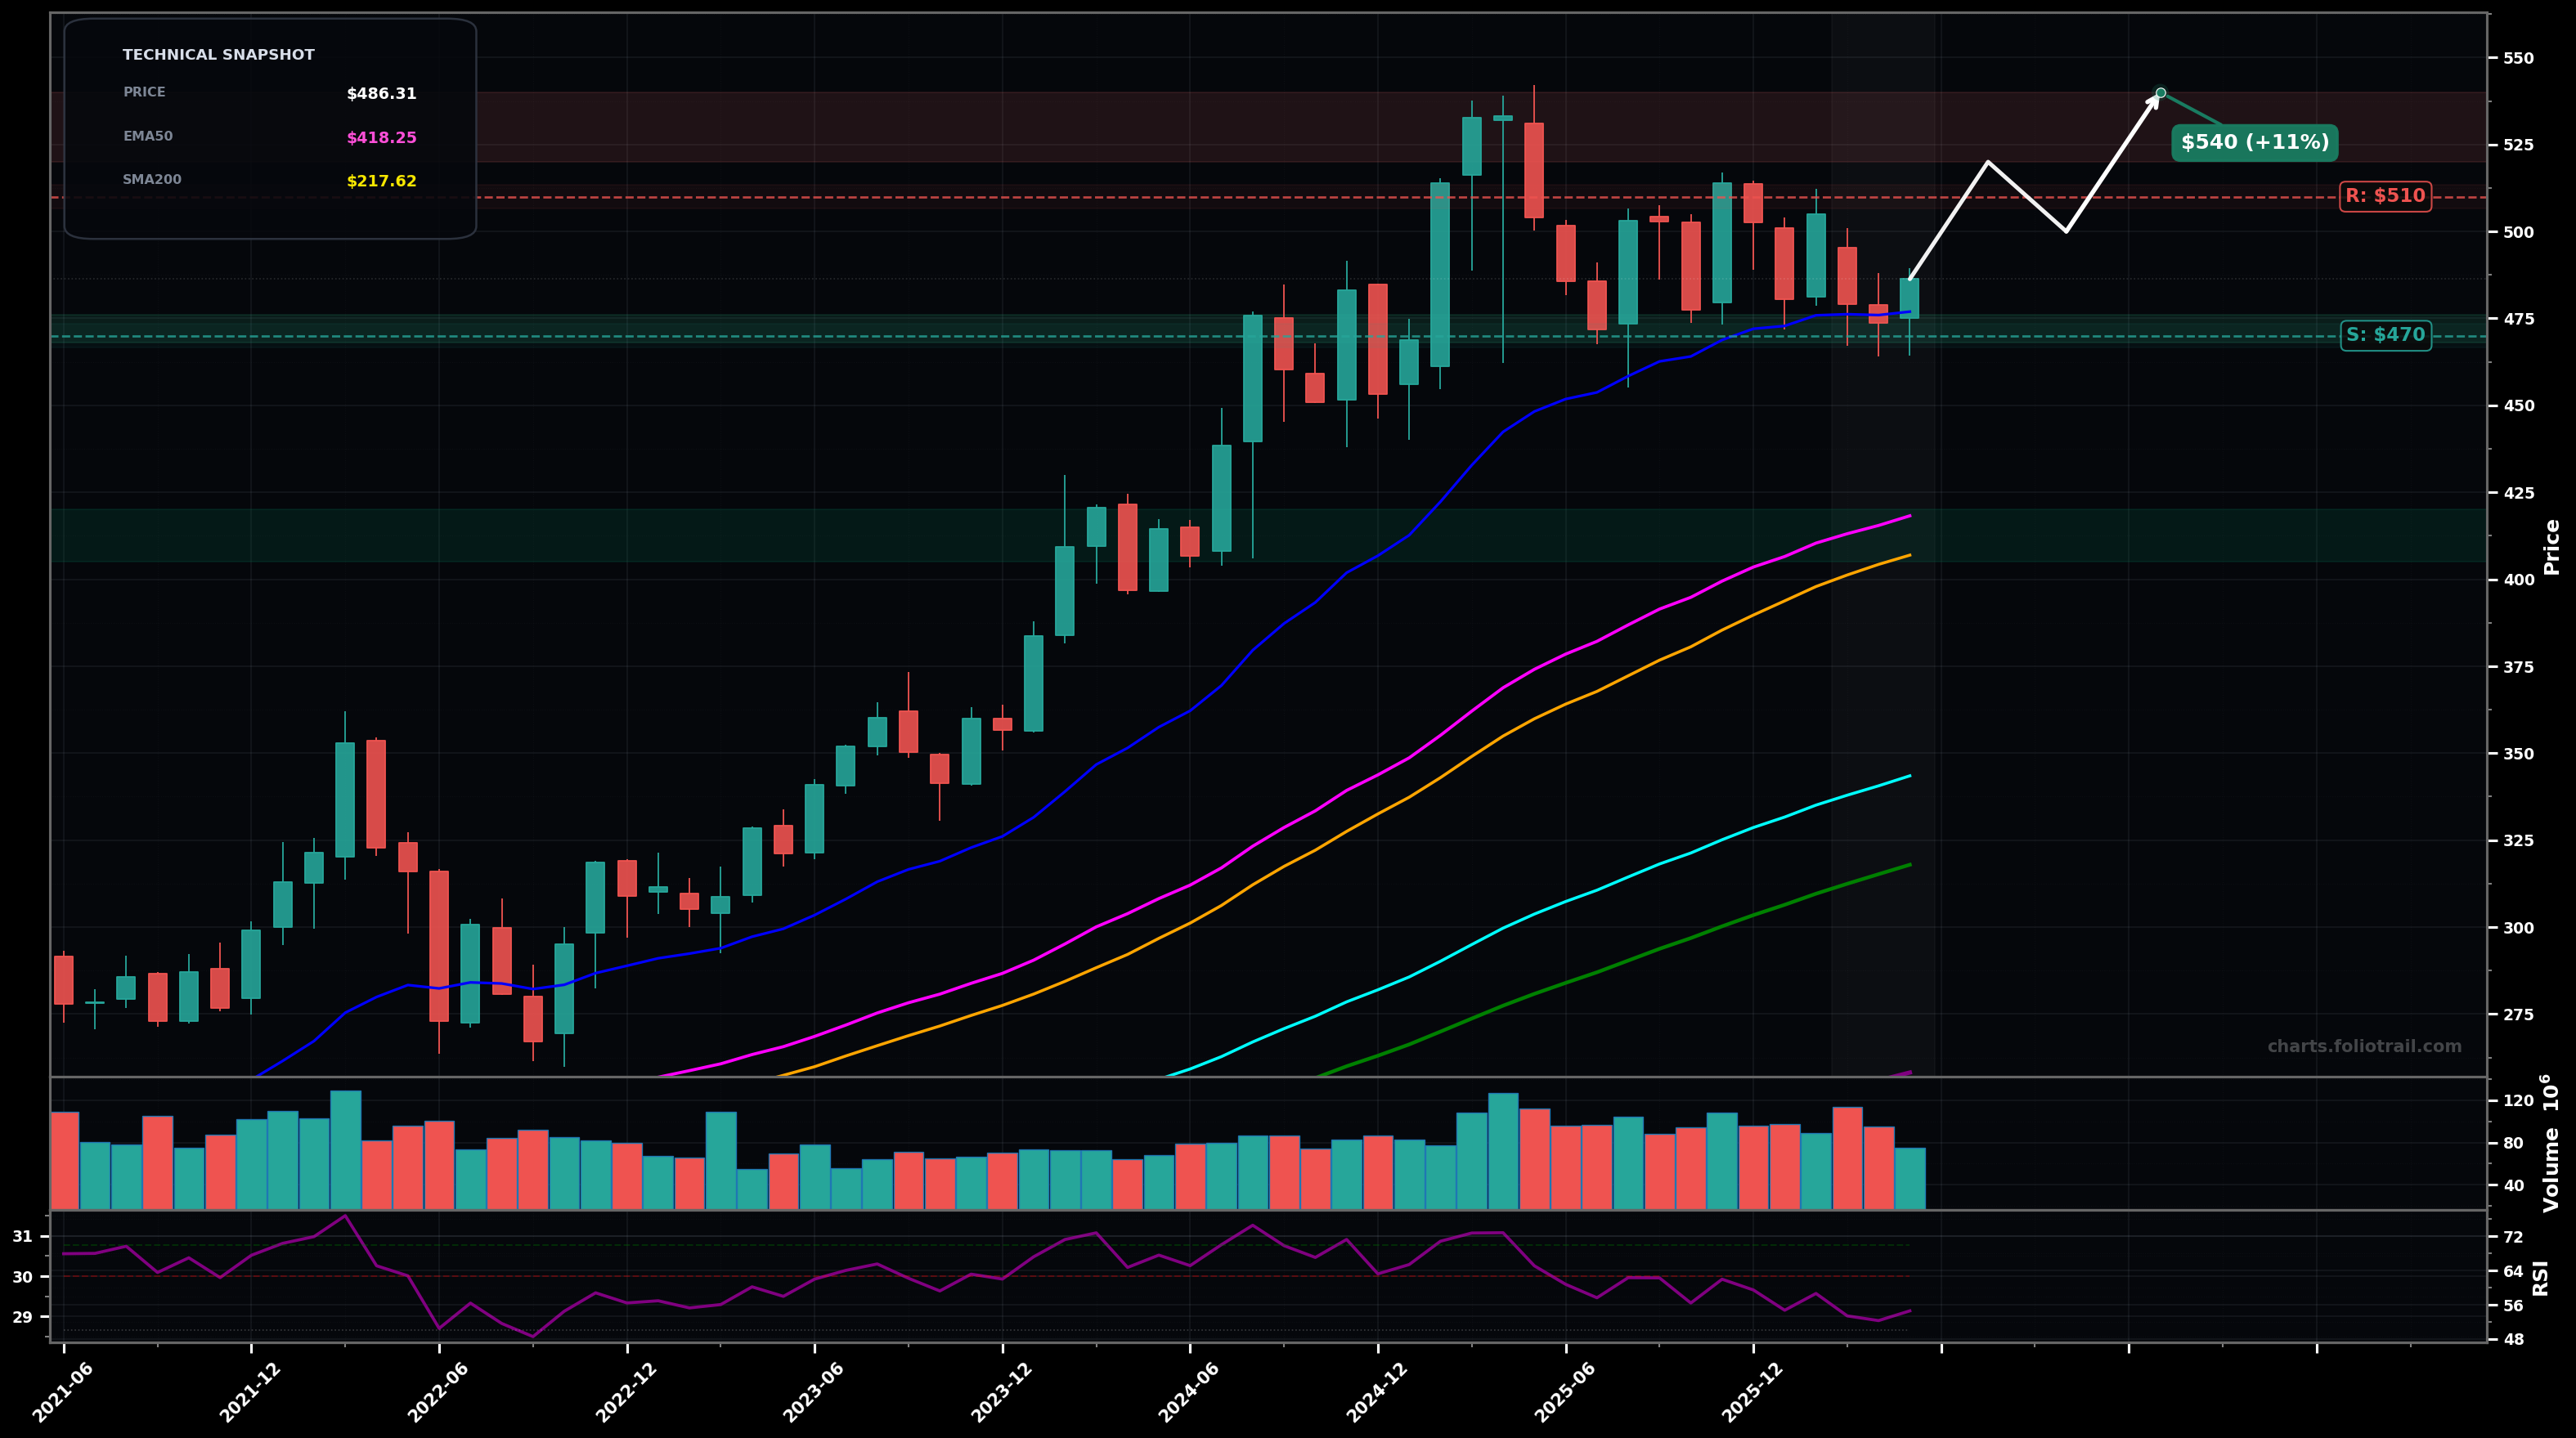
As of May 22, 2026, BRK.B (Berkshire Hathaway Inc. Class B) is in a choppy range state on the monthly chart, with a confidence level of 68%. Key support is at $470 and key resistance at $510. After a peak near ~$540, BRK.B has been consolidating in a tight ~$470–$510 band; latest close ~$486 is holding above the fast EMA cluster (EMA20/50) with RSI ~55 (neutral-bullish).
Range resolves higher: holding ~$470 and reclaiming ~$510 sets up a retest of the prior highs; this would fit an Elliott Wave view of a wave (4) consolidation before a final wave (5) push.
Range fails: loss of ~$470 triggers a deeper wave-(4) style correction/mean reversion toward the rising EMA50 (~$418) and then the prior breakout area/psych level; would also align with a Fibonacci-style retrace of the 2024–2025 impulse.
Monthly close above ~$510 with a second close holding above ~$510
Monthly close below ~$470
Start near range support (~$470); add on breakdown/retest toward prior structure (~$440s); heavy add near rising EMA50/SMA50 confluence (~$418–$407) where trend support is strongest.
Trim into prior high supply (~$520–$540); trim more if price extends beyond the old peak into an overextension zone; close if a multi-year upside extension (wave-5 blowoff / fib extension zone) develops well above trend MAs.
As of May 22, 2026, BRK.B (Berkshire Hathaway Inc. Class B) is in a choppy range state on the monthly chart with 68% confidence. After a peak near ~$540, BRK.B has been consolidating in a tight ~$470–$510 band; latest close ~$486 is holding above the fast EMA cluster (EMA20/50) with RSI ~55 (neutral-bullish).
On the monthly timeframe, BRK.B has key support at $470 and key resistance at $510. The most likely scenario (bullish) targets $520 and $540, with a revert level at $500.
BRK.B (Berkshire Hathaway Inc. Class B) is currently classified as choppy range on the monthly chart, with 68% confidence. Confirmation requires: Monthly close above ~$510 with a second close holding above ~$510 This would be invalidated by: Monthly close below ~$470
The most likely scenario (bullish) targets $520 and $540, with a revert level at $500. The alternative scenario (bearish) targets $440 and $418.
Multi-layer AI agents analyse 200+ stocks across daily, weekly, and monthly timeframes — producing market state classifications, price scenarios with targets, and position entry/exit levels. Daily charts updated every trading day at 6 PM ET. Weekly charts refresh Fridays. Monthly charts refresh on the last trading day of each month. No paywall. No sign-up required.
Built by Foliotrail.
All content on this website — including charts, analysis, price targets, support/resistance levels, and position zones — is generated entirely by AI and provided for educational and informational purposes only.
This is not financial advice. NEXUSNOIR VENTURES SL (the operator of this website) is not a registered investment adviser or broker-dealer. You should not make investment decisions based solely on this information. Always do your own research and consult a qualified financial advisor.
By continuing, you acknowledge that you have read and agree to our full disclaimer & terms of use and privacy policy.