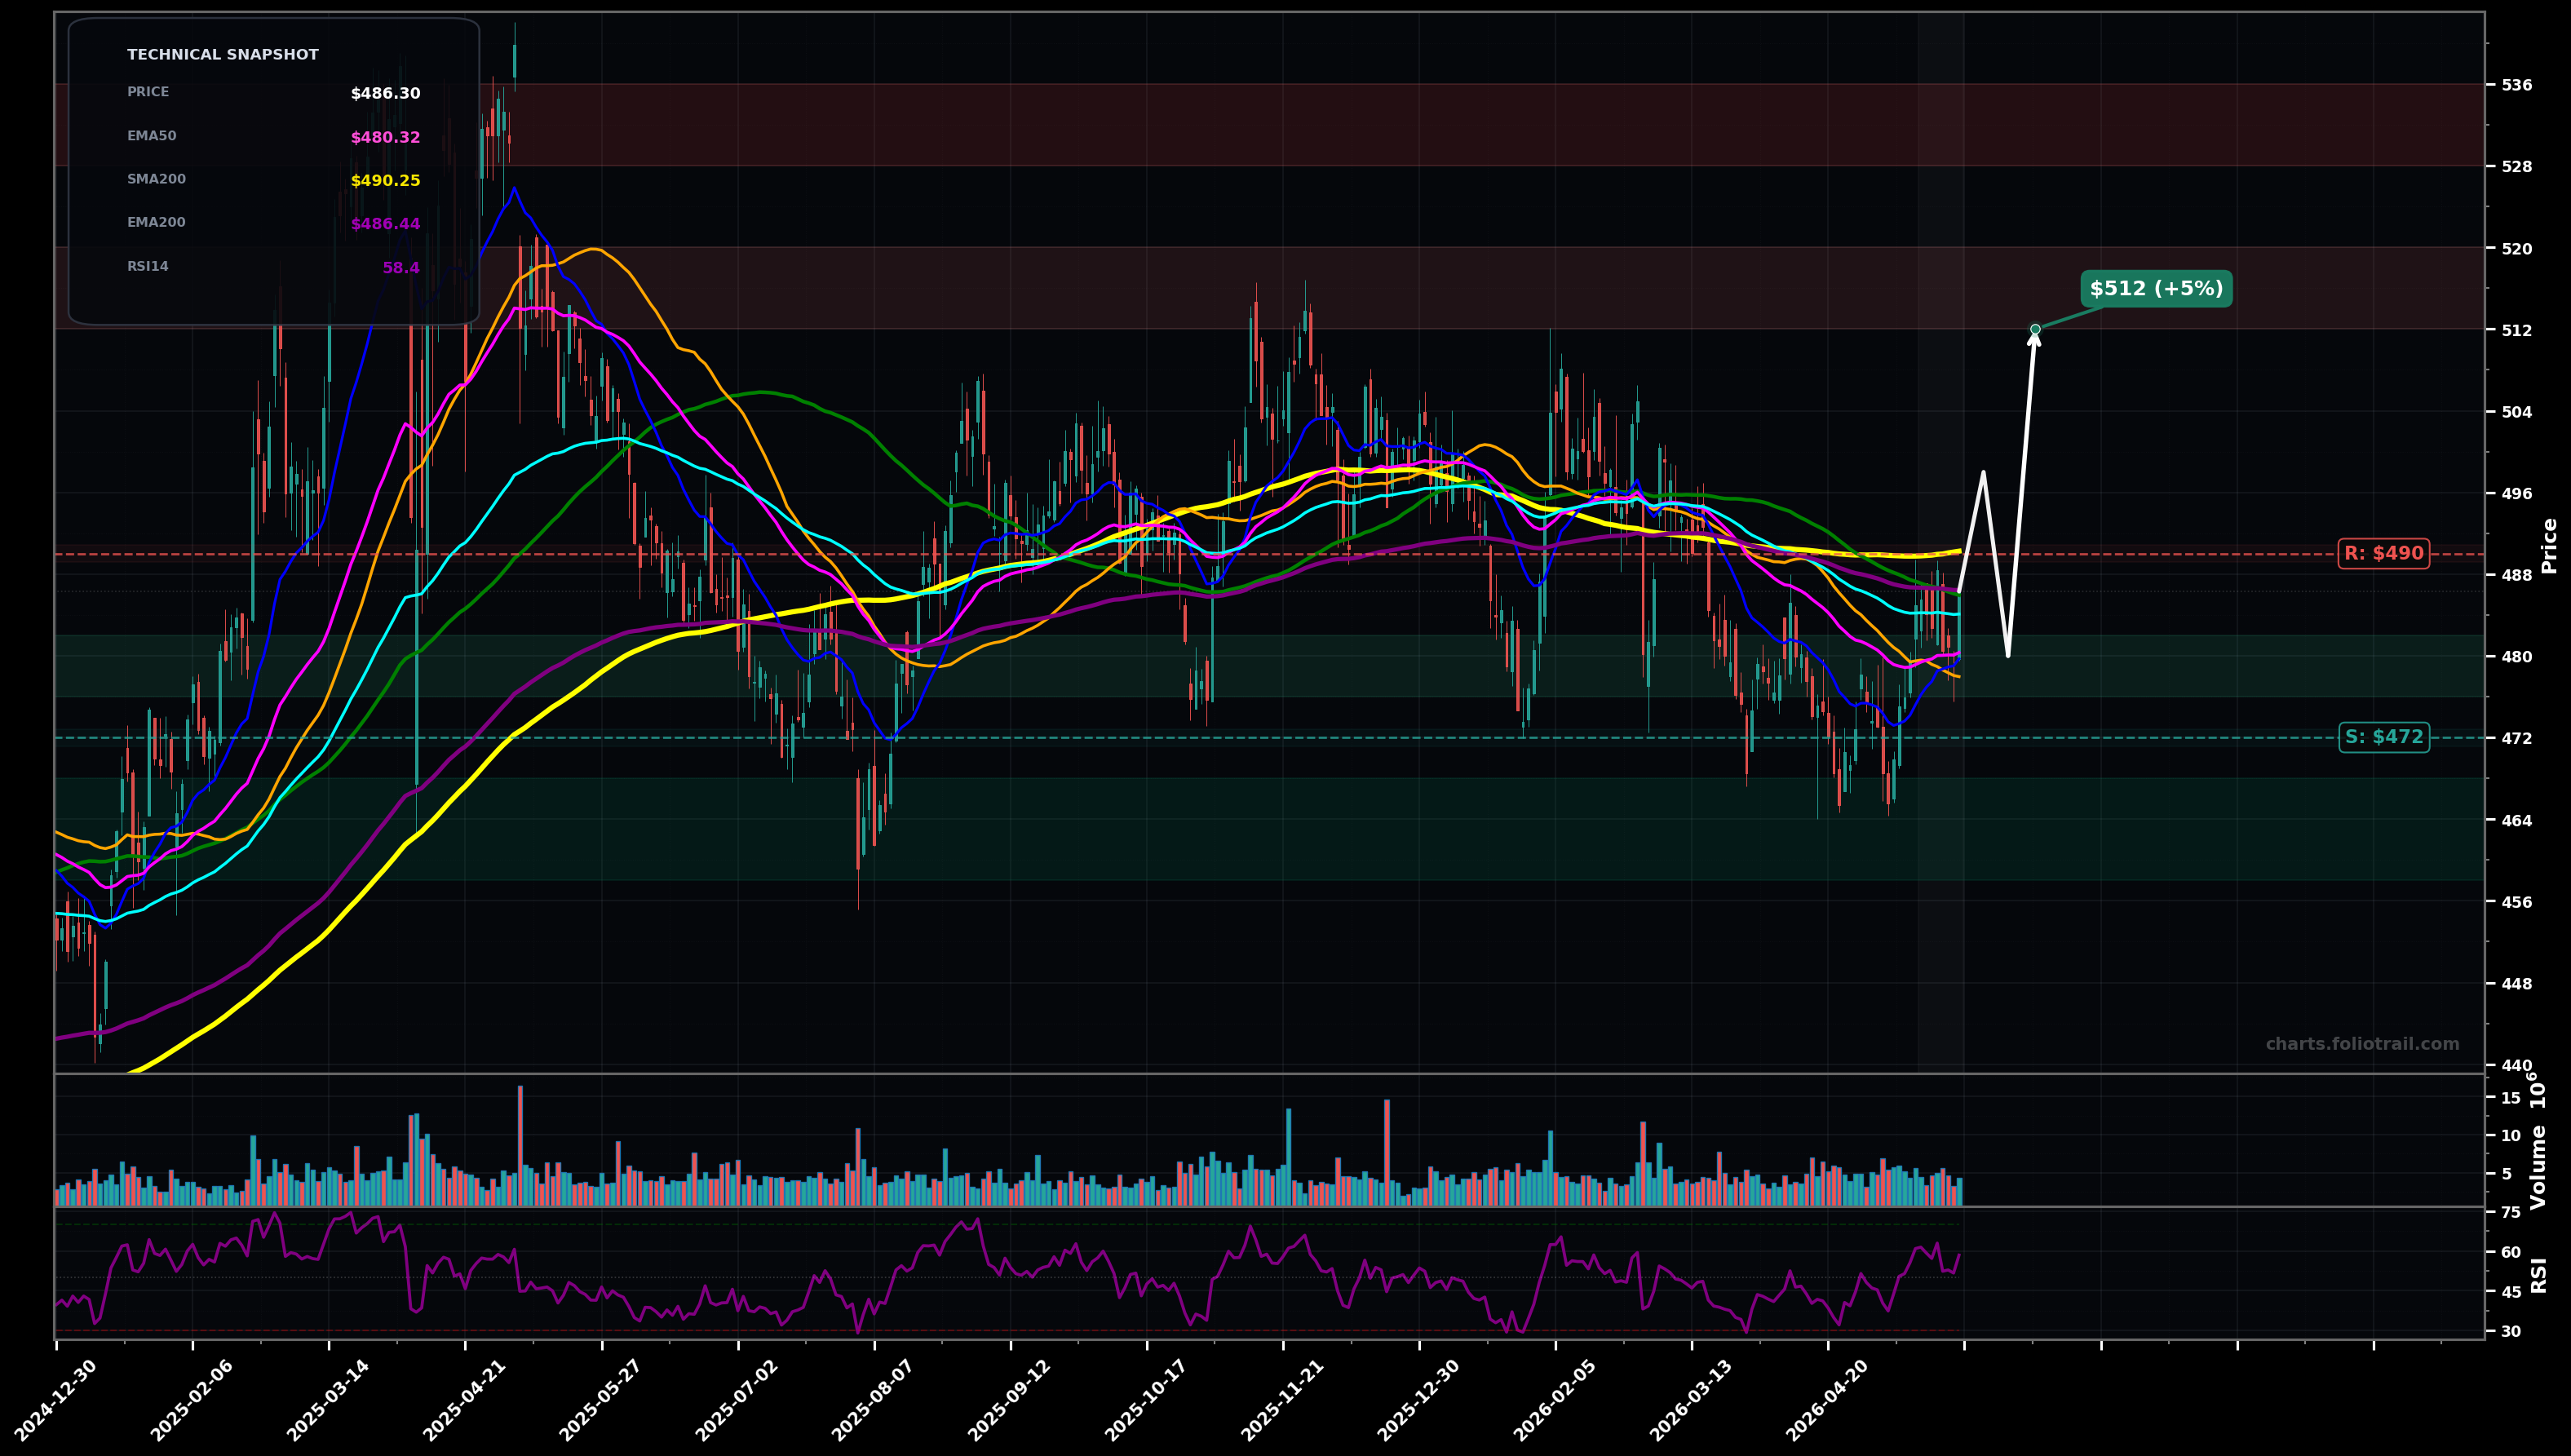
As of May 22, 2026, BRK.B (Berkshire Hathaway Inc. Class B) is in a choppy range state on the daily chart, with a confidence level of 62%. Key support is at $472 and key resistance at $490. Price ~$486.30 pushed back above clustered mid/long MAs (SMA200/100 + EMA100/200 around $484–$490) after a recent swing low near the mid-$460s; RSI14 ~58 indicates improving momentum.
Base-build then grind higher: hold above the MA cluster ($484–$490), retest $490 and break to the next supply zone; this would fit a larger sideways correction ending and a new impulsive leg starting (Elliott: late corrective wave (4) evolving into wave (5) attempt).
Failed reclaim and range breakdown: rejection at ~$490 followed by loss of $480, then sweep of the April swing low; this would suggest the sideways structure is resolving down (Elliott: corrective structure still unfolding, potential final C-leg).
2+ daily closes above $490 with a higher low holding above $480
Daily close below $472 (breaks the most recent swing-low support zone)
Start near reclaimed MA cluster support, add on $472 retest/hold, heavy add only on capitulation-type sweep into prior pivot lows ($460s) with quick reclaim.
Trim into prior supply/upper-range highs ($510s) and again near the 2025 peak zone ($530s); full close only if price becomes extended beyond the established multi-month range (Fibo extension/overextension risk).
As of May 22, 2026, BRK.B (Berkshire Hathaway Inc. Class B) is in a choppy range state on the daily chart with 62% confidence. Price ~$486.30 pushed back above clustered mid/long MAs (SMA200/100 + EMA100/200 around $484–$490) after a recent swing low near the mid-$460s; RSI14 ~58 indicates improving momentum.
On the daily timeframe, BRK.B has key support at $472 and key resistance at $490. The most likely scenario (bullish) targets $498 and $512, with a revert level at $480.
BRK.B (Berkshire Hathaway Inc. Class B) is currently classified as choppy range on the daily chart, with 62% confidence. Confirmation requires: 2+ daily closes above $490 with a higher low holding above $480 This would be invalidated by: Daily close below $472 (breaks the most recent swing-low support zone)
The most likely scenario (bullish) targets $498 and $512, with a revert level at $480. The alternative scenario (bearish) targets $472 and $462.
Multi-layer AI agents analyse 200+ stocks across daily, weekly, and monthly timeframes — producing market state classifications, price scenarios with targets, and position entry/exit levels. Daily charts updated every trading day at 6 PM ET. Weekly charts refresh Fridays. Monthly charts refresh on the last trading day of each month. No paywall. No sign-up required.
Built by Foliotrail.
All content on this website — including charts, analysis, price targets, support/resistance levels, and position zones — is generated entirely by AI and provided for educational and informational purposes only.
This is not financial advice. NEXUSNOIR VENTURES SL (the operator of this website) is not a registered investment adviser or broker-dealer. You should not make investment decisions based solely on this information. Always do your own research and consult a qualified financial advisor.
By continuing, you acknowledge that you have read and agree to our full disclaimer & terms of use and privacy policy.