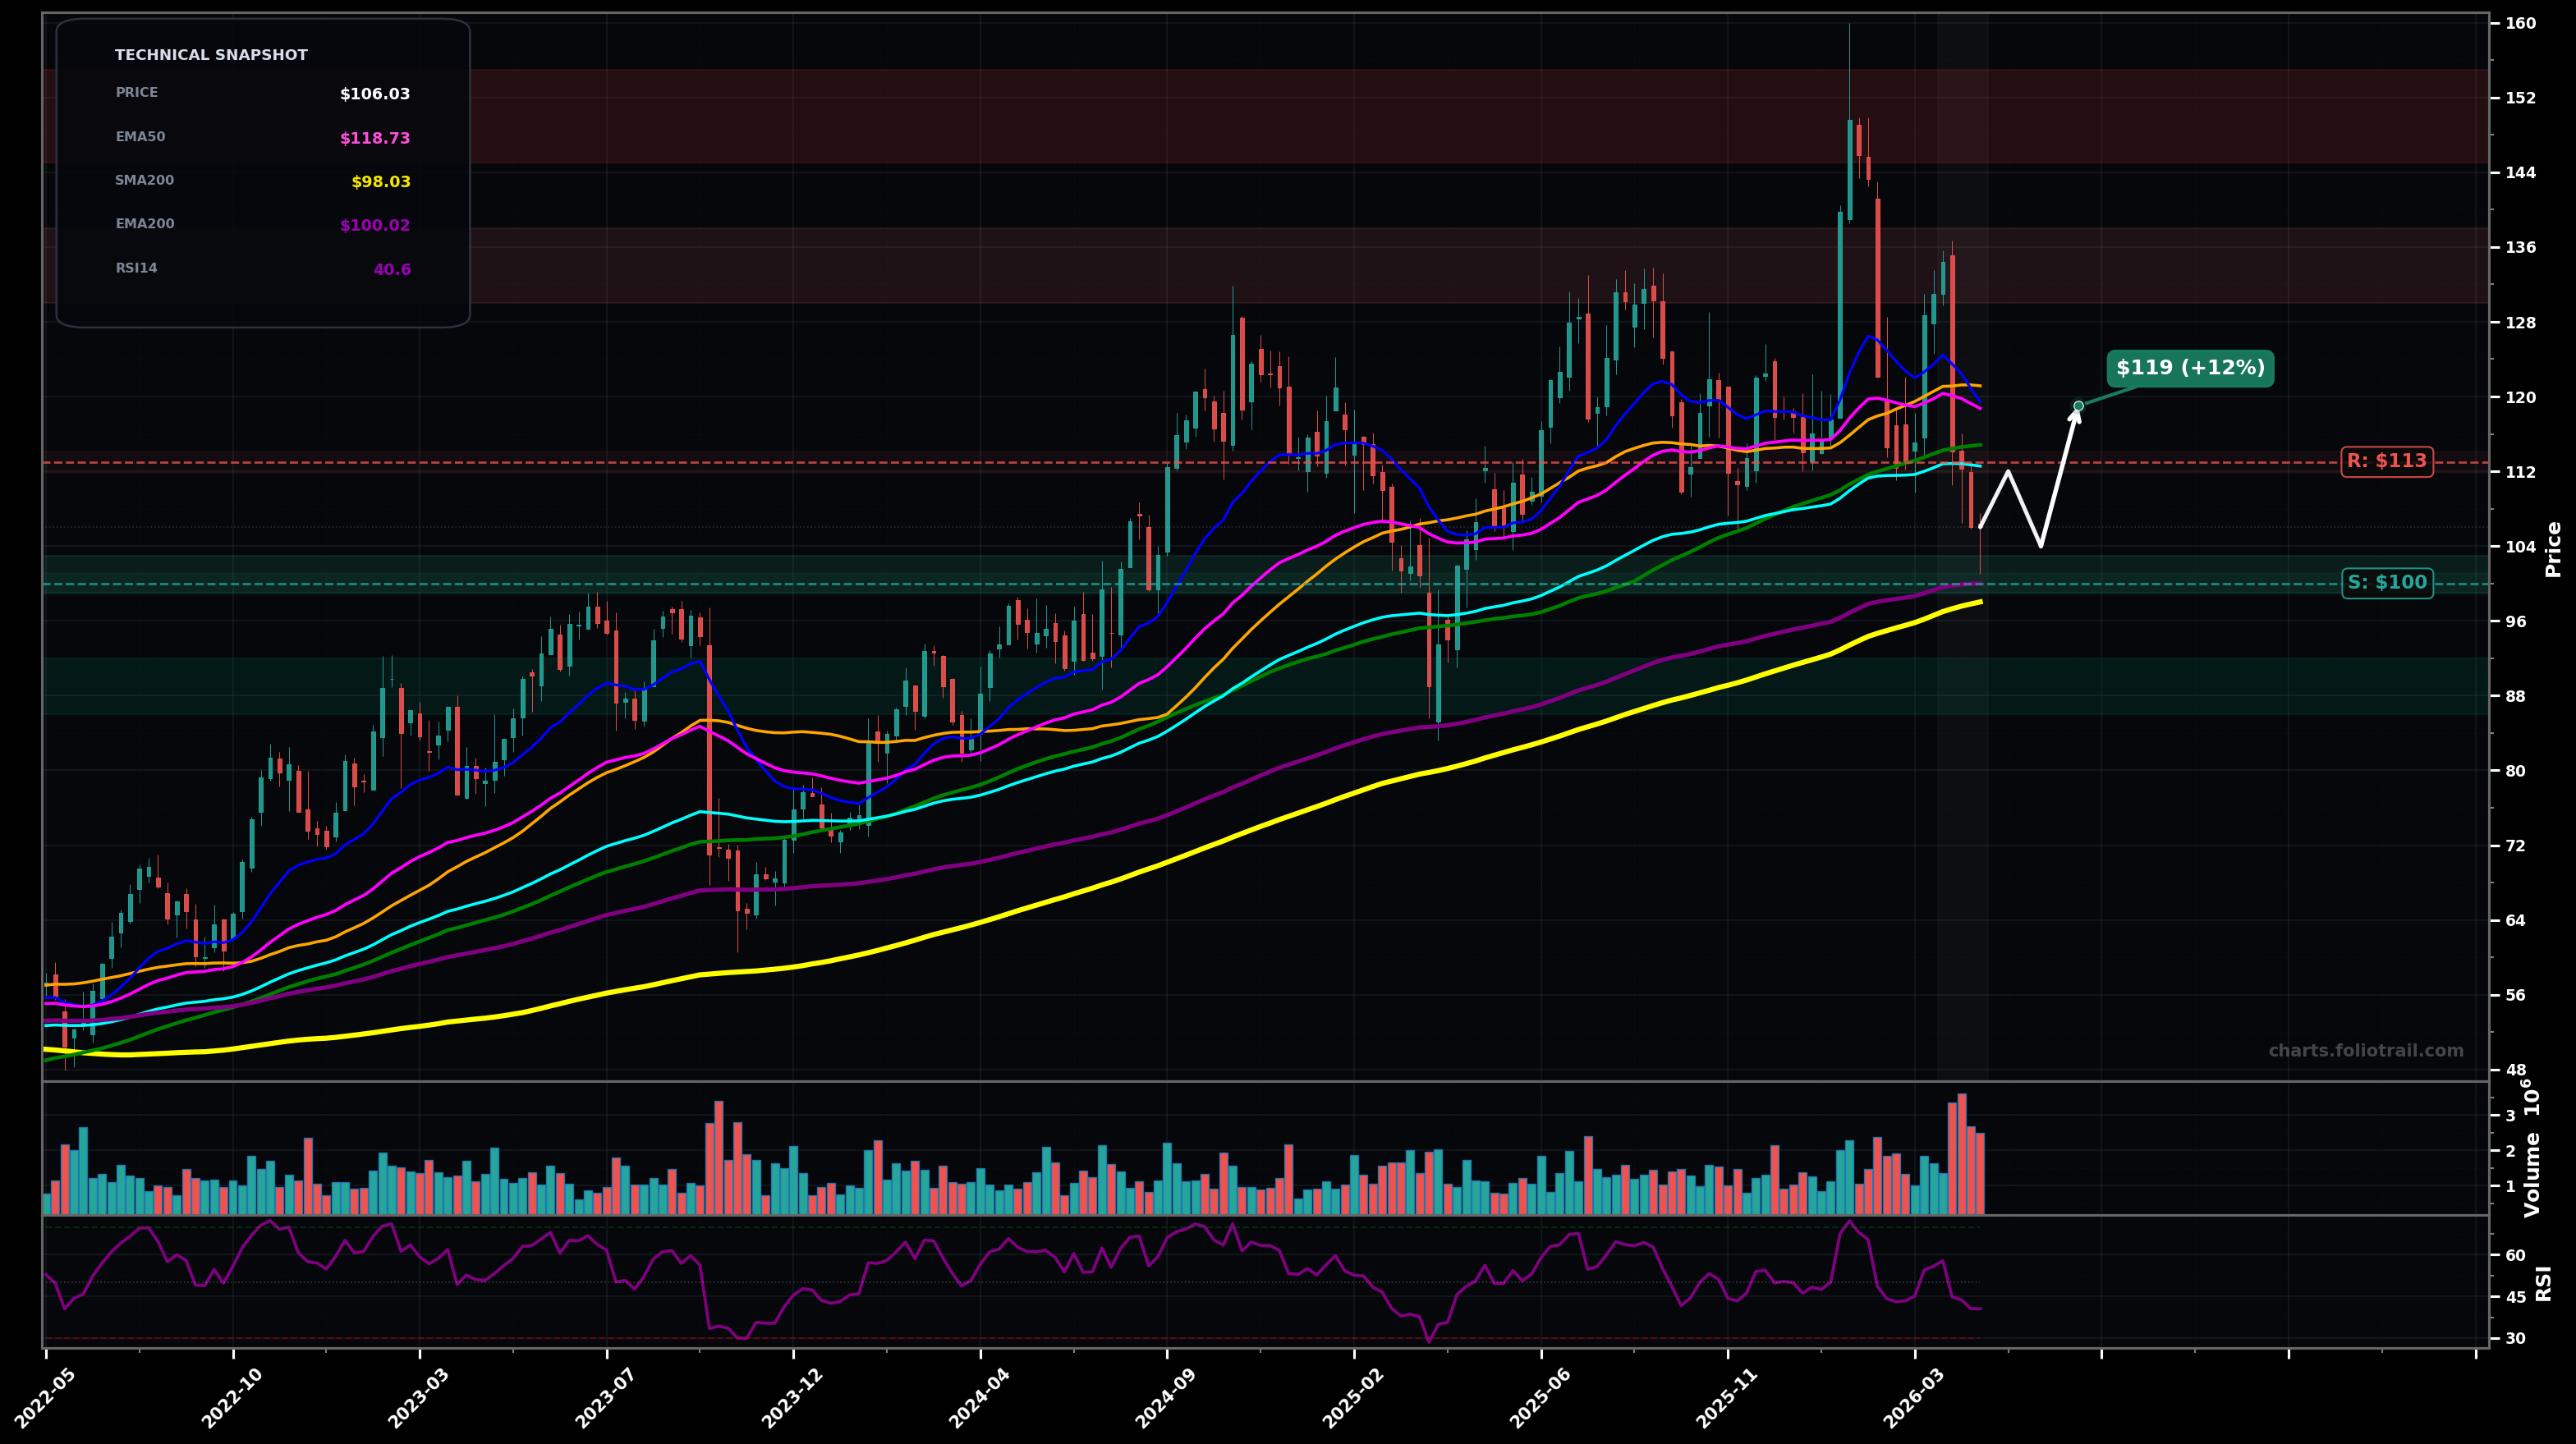
As of May 22, 2026, BDC (Belden Inc.) is in a downtrend state on the weekly chart, with a confidence level of 72%. Key support is at $100 and key resistance at $113. Weekly selloff with consecutive red candles; price at $106.03 broke below EMA50 ($118.73) and EMA100 ($112.56) and is testing the EMA200/SMA200 cluster (~$100).
Base attempt at the $100 long-term MA cluster (EMA200/SMA200) followed by a rebound/mean-reversion into the broken EMA100 area; then either stall or form a lower high.
Breakdown through the $100 MA cluster (support fails), extending the correction toward the prior consolidation zone and a deeper fib-style retrace of the 2024–2026 advance.
Weekly close below $100 (EMA200/SMA200 zone) with follow-through the next week
Two consecutive weekly closes back above $112
Scale-in around the EMA200/SMA200 confluence (~$100); add if breakdown retests fail (lower support shelves ~$96 and ~$88).
Trim into prior supply from the 2026 spike/rejection zone ($130+), with aggressive de-risking near the blow-off high area ($145–$160).
As of May 22, 2026, BDC (Belden Inc.) is in a downtrend state on the weekly chart with 72% confidence. Weekly selloff with consecutive red candles; price at $106.03 broke below EMA50 ($118.73) and EMA100 ($112.56) and is testing the EMA200/SMA200 cluster (~$100).
On the weekly timeframe, BDC has key support at $100 and key resistance at $113. The most likely scenario (bullish) targets $112 and $119, with a revert level at $104.
BDC (Belden Inc.) is currently classified as downtrend on the weekly chart, with 72% confidence. Confirmation requires: Weekly close below $100 (EMA200/SMA200 zone) with follow-through the next week This would be invalidated by: Two consecutive weekly closes back above $112
The most likely scenario (bullish) targets $112 and $119, with a revert level at $104. The alternative scenario (bearish) targets $96.0 and $88.0.
Multi-layer AI agents analyse 200+ stocks across daily, weekly, and monthly timeframes — producing market state classifications, price scenarios with targets, and position entry/exit levels. Daily charts updated every trading day at 6 PM ET. Weekly charts refresh Fridays. Monthly charts refresh on the last trading day of each month. No paywall. No sign-up required.
Built by Foliotrail.
All content on this website — including charts, analysis, price targets, support/resistance levels, and position zones — is generated entirely by AI and provided for educational and informational purposes only.
This is not financial advice. NEXUSNOIR VENTURES SL (the operator of this website) is not a registered investment adviser or broker-dealer. You should not make investment decisions based solely on this information. Always do your own research and consult a qualified financial advisor.
By continuing, you acknowledge that you have read and agree to our full disclaimer & terms of use and privacy policy.