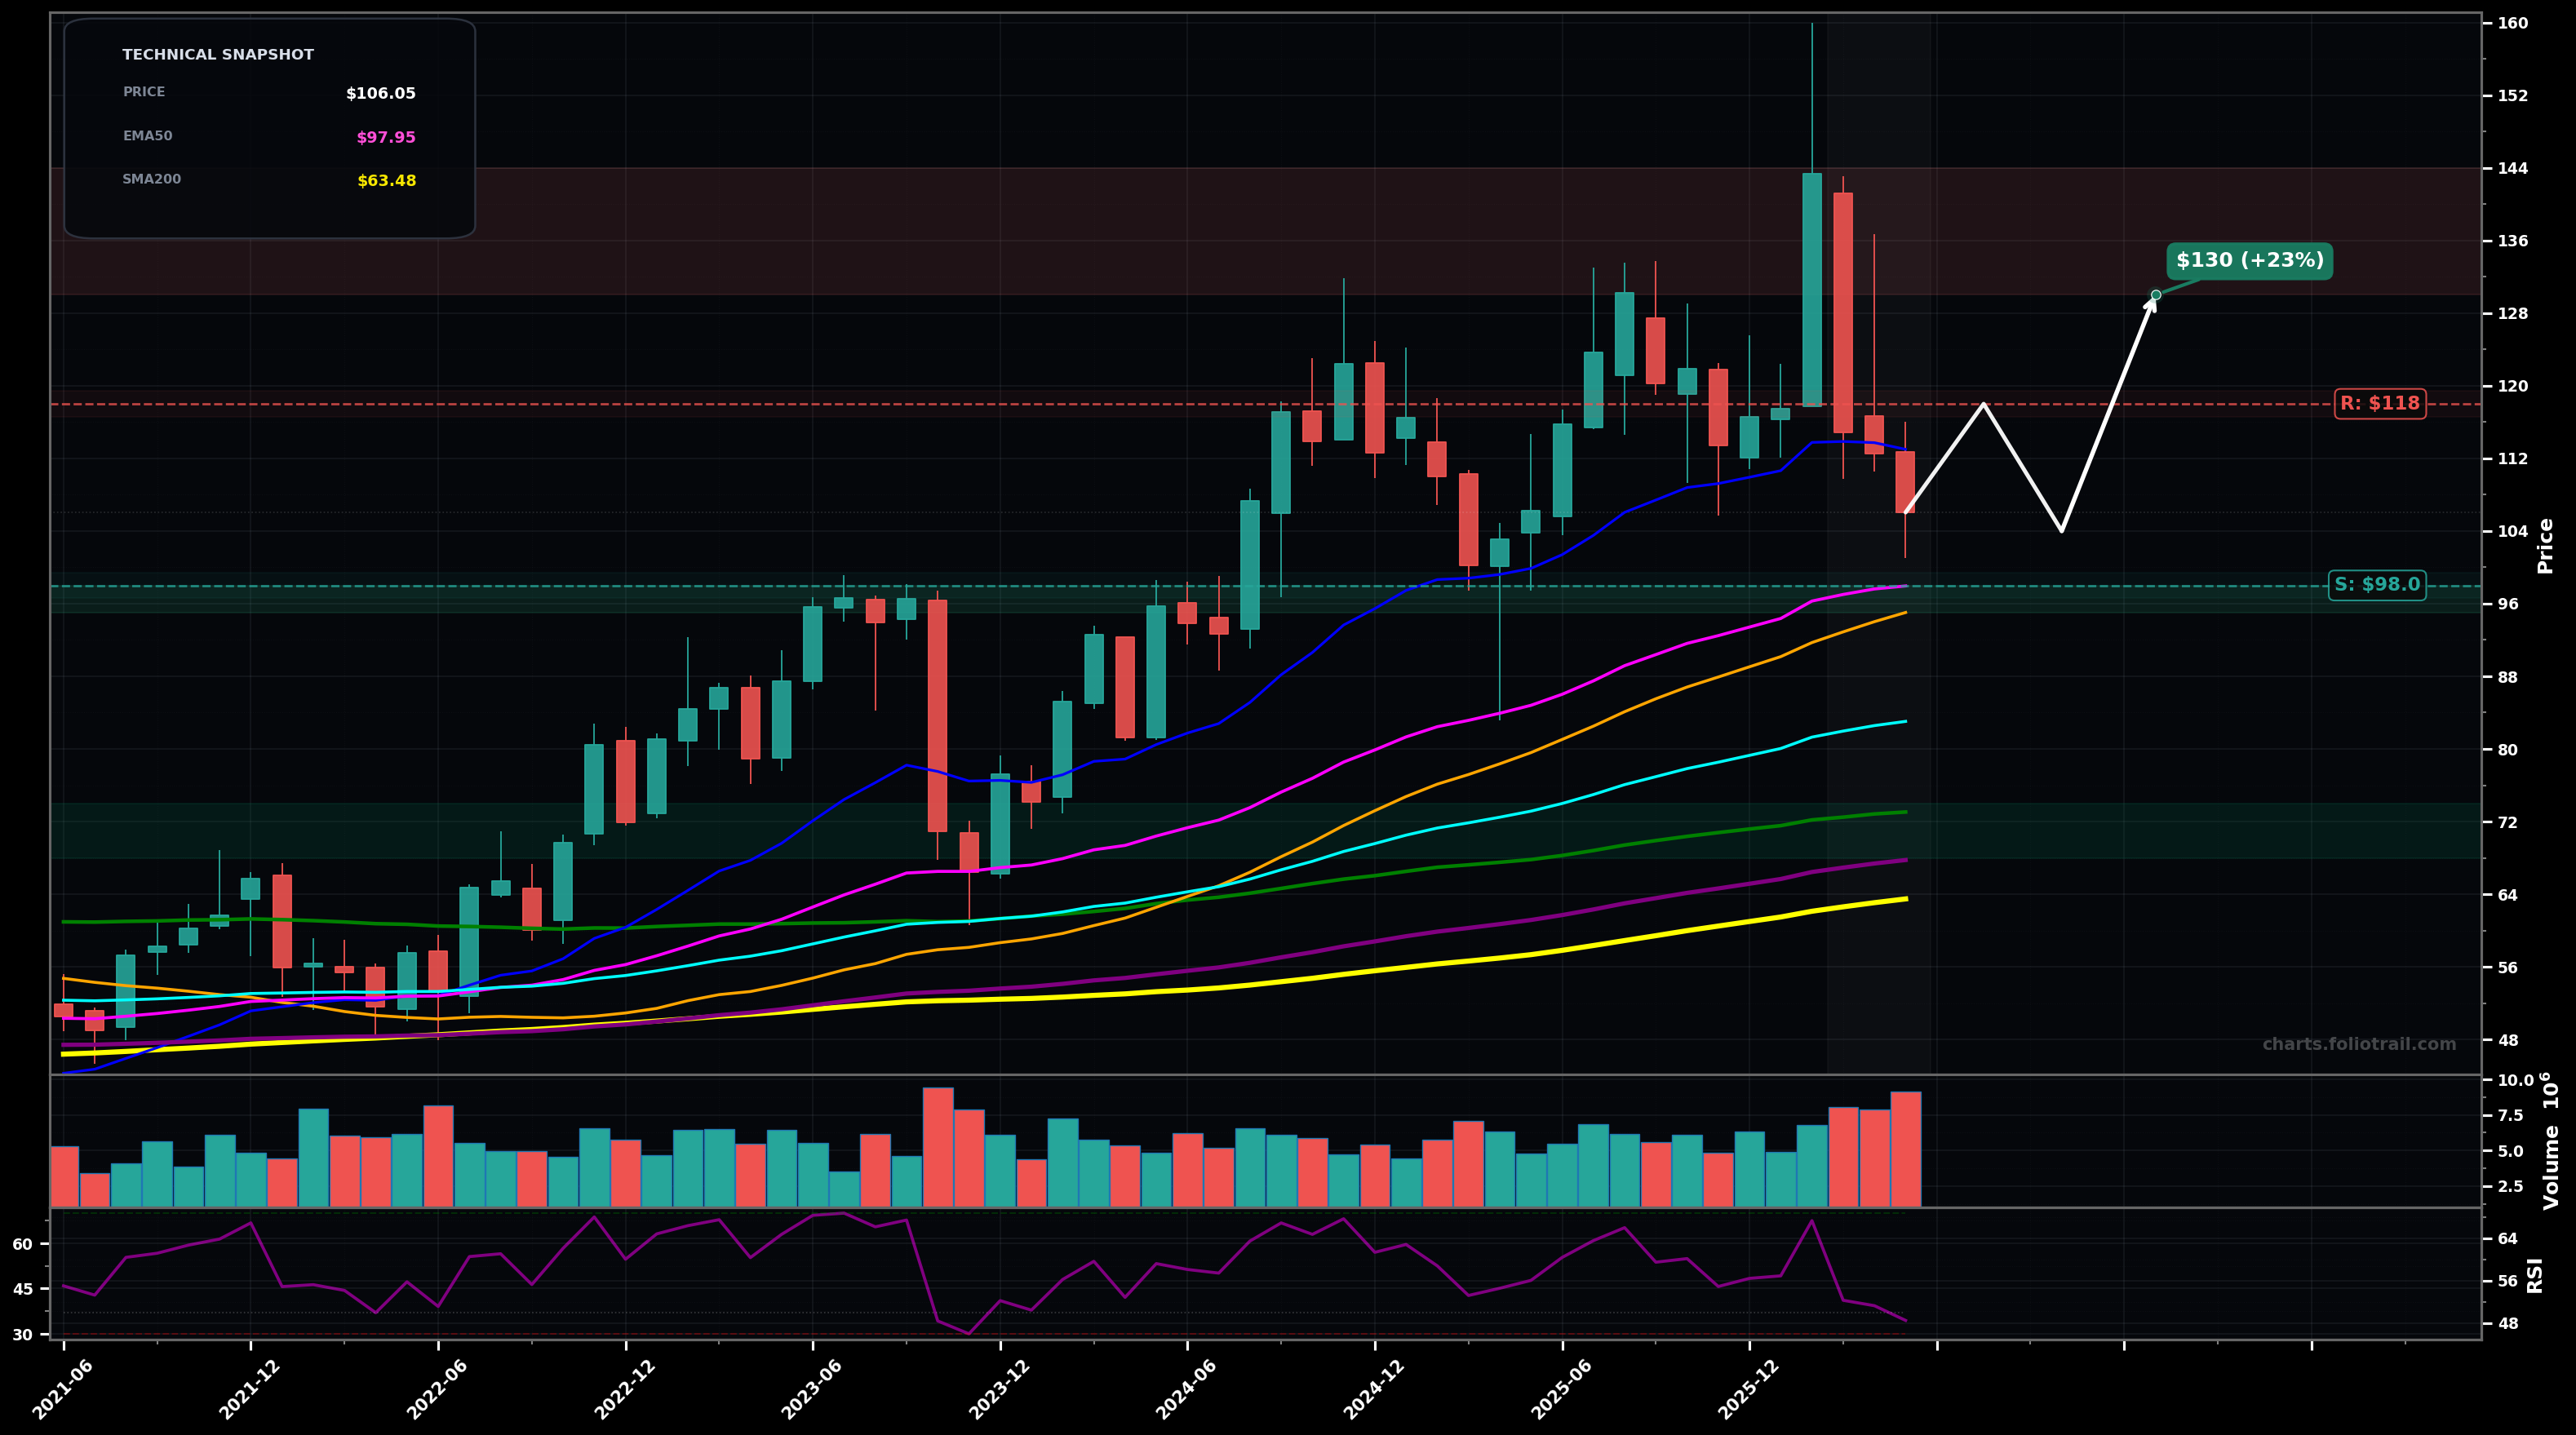
As of May 22, 2026, BDC (Belden Inc.) is in a volatility expansion state on the monthly chart, with a confidence level of 72%. Key support is at $98.0 and key resistance at $118. Monthly uptrend pulled back hard from a blow-off spike near ~$160; last 2 candles are heavy red, price now ~$106 sitting just above rising EMA50 (~$98) and above SMA50 (~$95).
Mean-reversion pullback holds the rising EMA50/SMA50 zone ($98–$95), then chops and rebounds to retest the breakdown area near $118; if reclaimed, next magnet is ~$130.
Break of EMA50 triggers deeper correction toward the prior base/EMA100 area; bounce attempts likely fail first near $98–$100 before another leg down.
2+ monthly closes below $98 (EMA50) would confirm downside expansion/transition to DOWNTREND risk
Monthly close back above $118 would invalidate immediate bearish expansion and favor resumed uptrend
Use MA confluence as dip zones: EMA50/SMA50 ($98–$95) first, then EMA100 (~$83) and finally EMA200/SMA200 (~$68–$63) if volatility stays elevated.
Fibo/structure suggests $130–$144 is first major supply (prior consolidation + round levels), $145–$160 is blow-off supply (likely wave-5 exhaustion), and $165+ would be extreme extension vs long MAs where risk/reward deteriorates sharply.
As of May 22, 2026, BDC (Belden Inc.) is in a volatility expansion state on the monthly chart with 72% confidence. Monthly uptrend pulled back hard from a blow-off spike near ~$160; last 2 candles are heavy red, price now ~$106 sitting just above rising EMA50 (~$98) and above SMA50 (~$95).
On the monthly timeframe, BDC has key support at $98.0 and key resistance at $118. The most likely scenario (bullish) targets $118 and $130, with a revert level at $104.
BDC (Belden Inc.) is currently classified as volatility expansion on the monthly chart, with 72% confidence. Confirmation requires: 2+ monthly closes below $98 (EMA50) would confirm downside expansion/transition to DOWNTREND risk This would be invalidated by: Monthly close back above $118 would invalidate immediate bearish expansion and favor resumed uptrend
The most likely scenario (bullish) targets $118 and $130, with a revert level at $104. The alternative scenario (bearish) targets $95.0 and $83.0.
Multi-layer AI agents analyse 200+ stocks across daily, weekly, and monthly timeframes — producing market state classifications, price scenarios with targets, and position entry/exit levels. Daily charts updated every trading day at 6 PM ET. Weekly charts refresh Fridays. Monthly charts refresh on the last trading day of each month. No paywall. No sign-up required.
Built by Foliotrail.
All content on this website — including charts, analysis, price targets, support/resistance levels, and position zones — is generated entirely by AI and provided for educational and informational purposes only.
This is not financial advice. NEXUSNOIR VENTURES SL (the operator of this website) is not a registered investment adviser or broker-dealer. You should not make investment decisions based solely on this information. Always do your own research and consult a qualified financial advisor.
By continuing, you acknowledge that you have read and agree to our full disclaimer & terms of use and privacy policy.