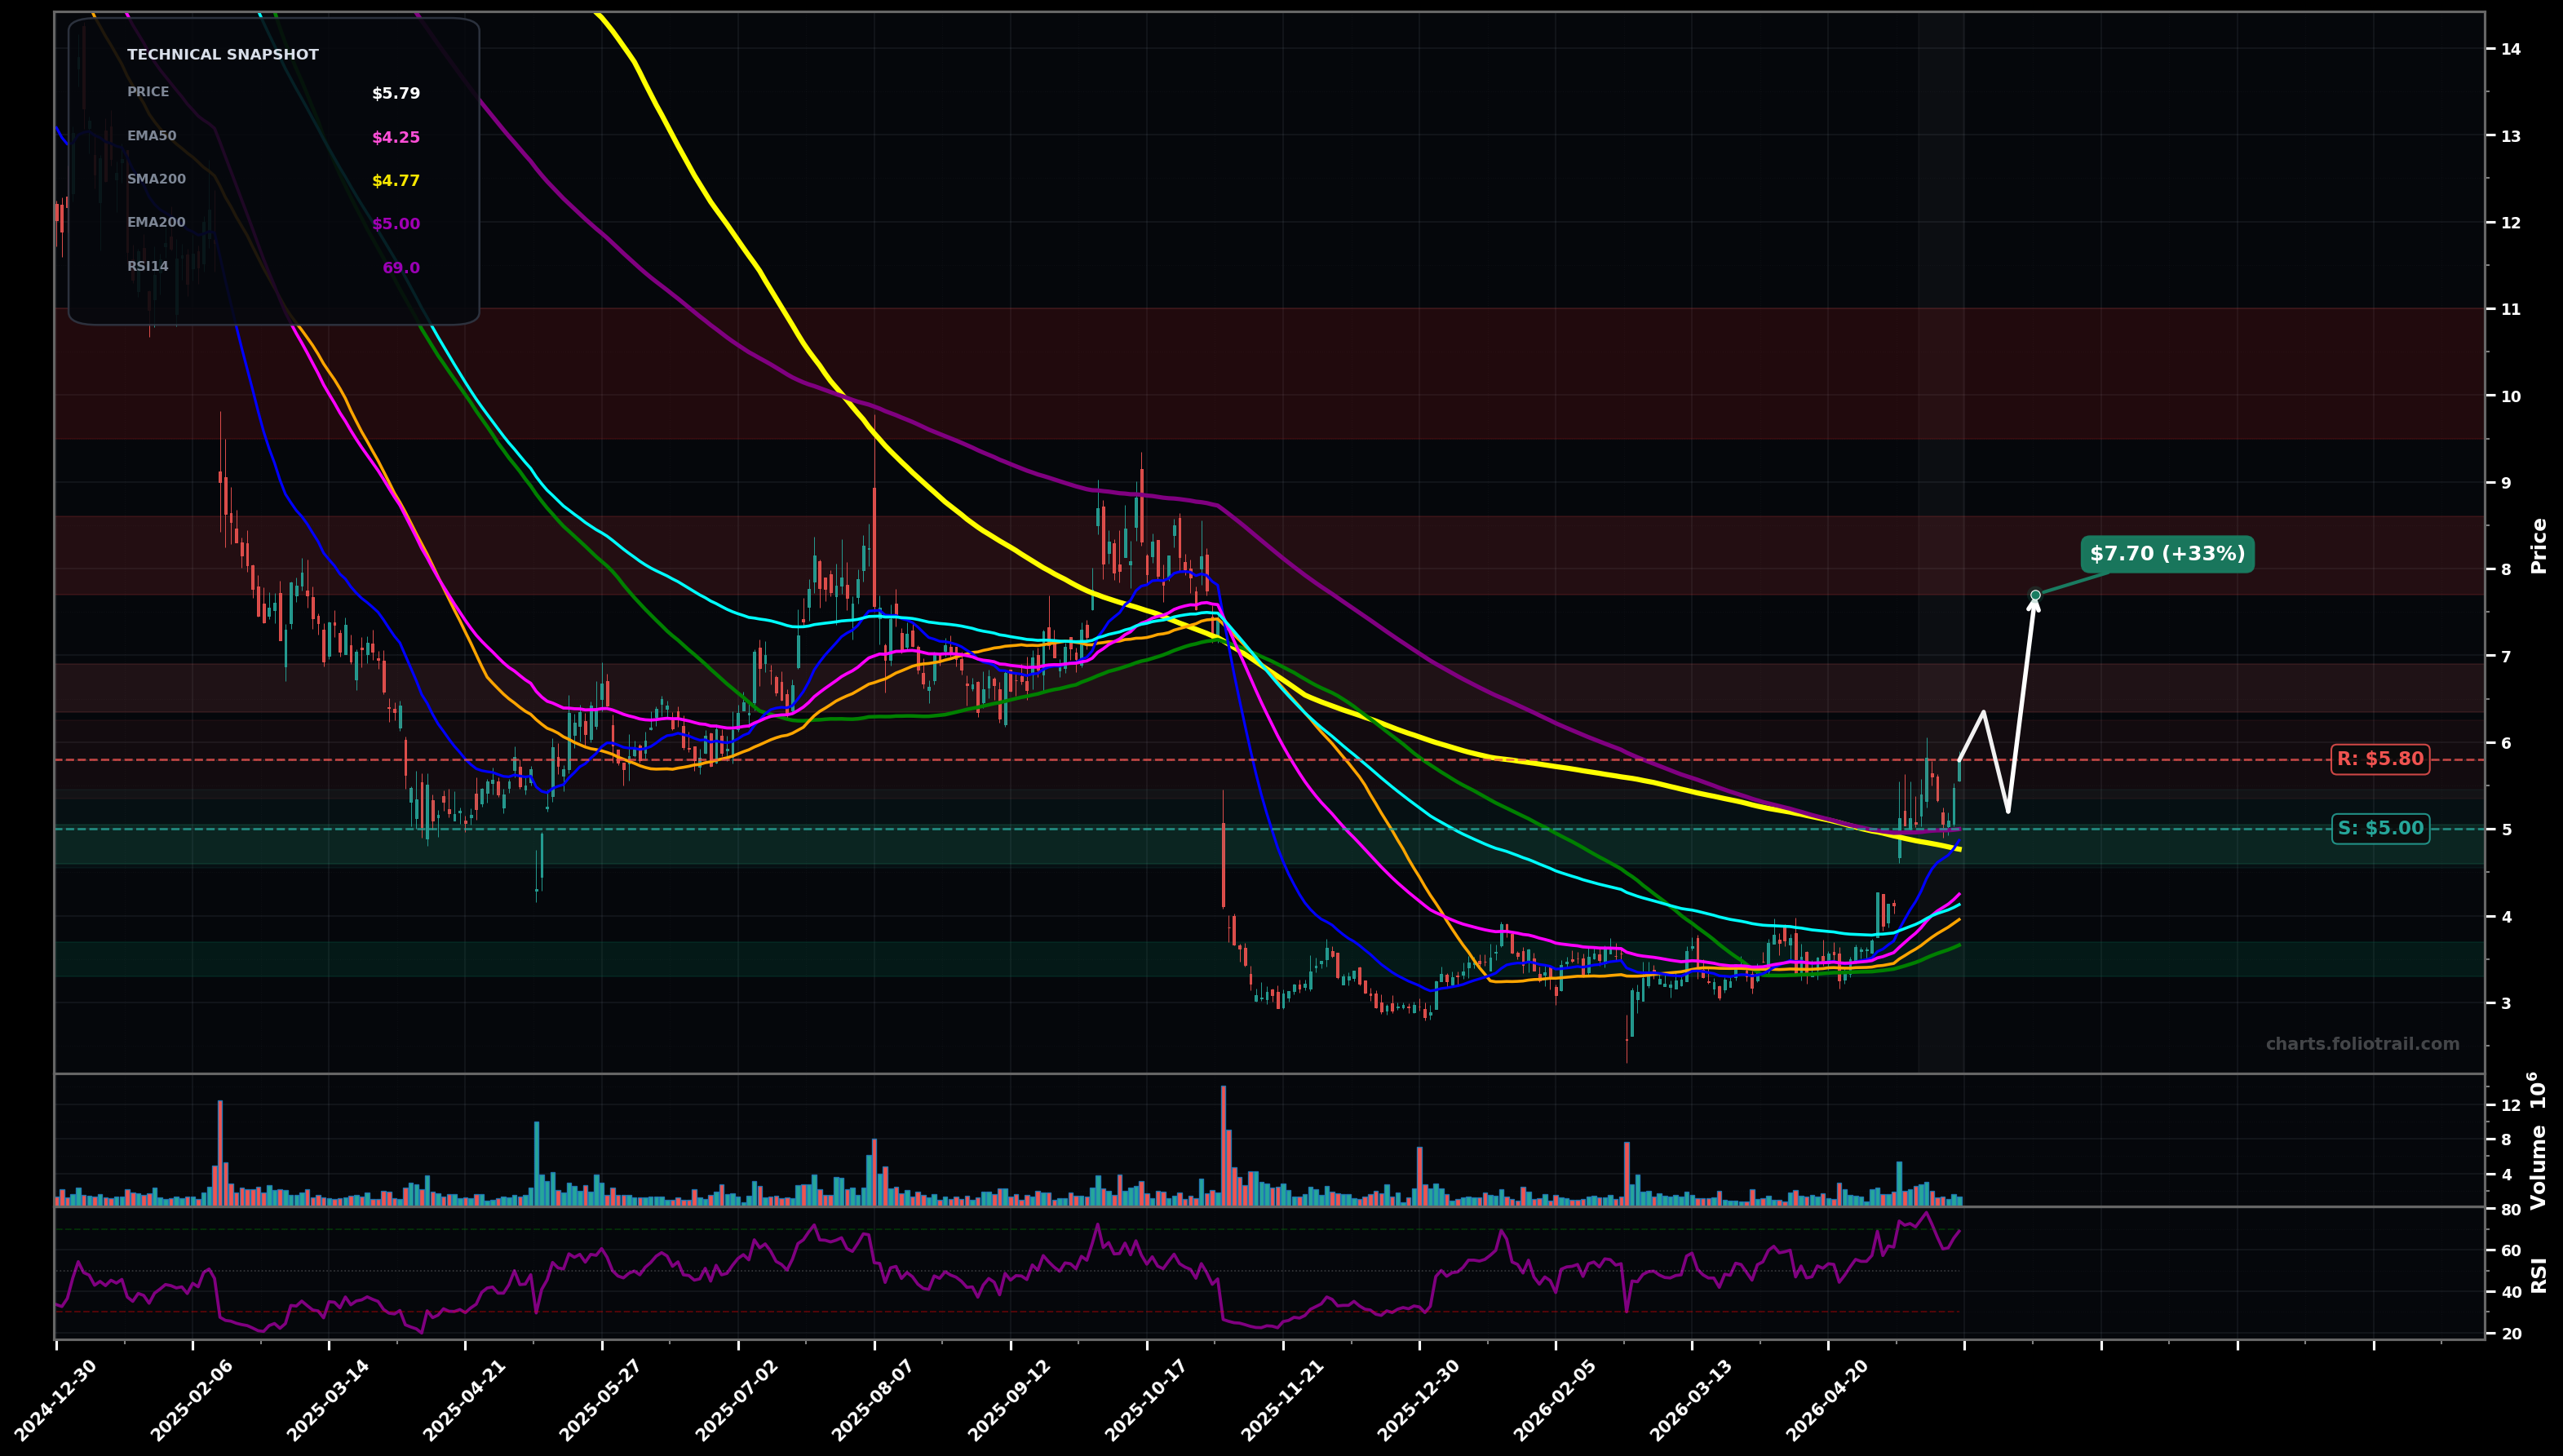
As of May 22, 2026, ASPN (Aspen Aerogels Inc.) is in a breakout reversal state on the daily chart, with a confidence level of 63%. Key support is at $5.00 and key resistance at $5.80. Sharp rally off the base; price is now above EMA50/EMA100 and pushing into the heavy MA band near the declining SMA200/EMA200 ($5.00–$5.80) with RSI hot (~69).
Bullish continuation: price consolidates briefly above $5.00, then breaks the $5.80 long-MA ceiling; next leg targets the prior supply zone from the last swing breakdown.
Pullback/retest: rejection at $5.80 leads to a mean-reversion test of EMA50/EMA100; if buyers defend, it becomes a higher low and re-attempts the breakout later.
Daily closes hold above $5.00 for 2+ sessions and then break/hold above $5.80 (SMA200/EMA200 zone).
Close back below $4.25 (EMA50 area) would negate the breakout-reversal structure.
Start on pullback to reclaimed $5.00/short-MA support; add on EMA50/EMA100 confluence; heavy add only on deep retest of the established base support (~$3.3–$3.7).
Trim into overhead supply/resistance zones (likely Fib retracements of the prior decline and former pivots); escalate trimming as price gets extended above rising EMA50 and into prior distribution ($7.7+), close if a full mean-reversion-to-previous-cycle highs plays out ($9.5–$11).
As of May 22, 2026, ASPN (Aspen Aerogels Inc.) is in a breakout reversal state on the daily chart with 63% confidence. Sharp rally off the base; price is now above EMA50/EMA100 and pushing into the heavy MA band near the declining SMA200/EMA200 ($5.00–$5.80) with RSI hot (~69).
On the daily timeframe, ASPN has key support at $5.00 and key resistance at $5.80. The most likely scenario (bullish) targets $6.35 and $7.70, with a revert level at $5.20.
ASPN (Aspen Aerogels Inc.) is currently classified as breakout reversal on the daily chart, with 63% confidence. Confirmation requires: Daily closes hold above $5.00 for 2+ sessions and then break/hold above $5.80 (SMA200/EMA200 zone). This would be invalidated by: Close back below $4.25 (EMA50 area) would negate the breakout-reversal structure.
The most likely scenario (bullish) targets $6.35 and $7.70, with a revert level at $5.20. The alternative scenario (bearish) targets $4.60 and $3.60.
Multi-layer AI agents analyse 200+ stocks across daily, weekly, and monthly timeframes — producing market state classifications, price scenarios with targets, and position entry/exit levels. Daily charts updated every trading day at 6 PM ET. Weekly charts refresh Fridays. Monthly charts refresh on the last trading day of each month. No paywall. No sign-up required.
Built by Foliotrail.
All content on this website — including charts, analysis, price targets, support/resistance levels, and position zones — is generated entirely by AI and provided for educational and informational purposes only.
This is not financial advice. NEXUSNOIR VENTURES SL (the operator of this website) is not a registered investment adviser or broker-dealer. You should not make investment decisions based solely on this information. Always do your own research and consult a qualified financial advisor.
By continuing, you acknowledge that you have read and agree to our full disclaimer & terms of use and privacy policy.