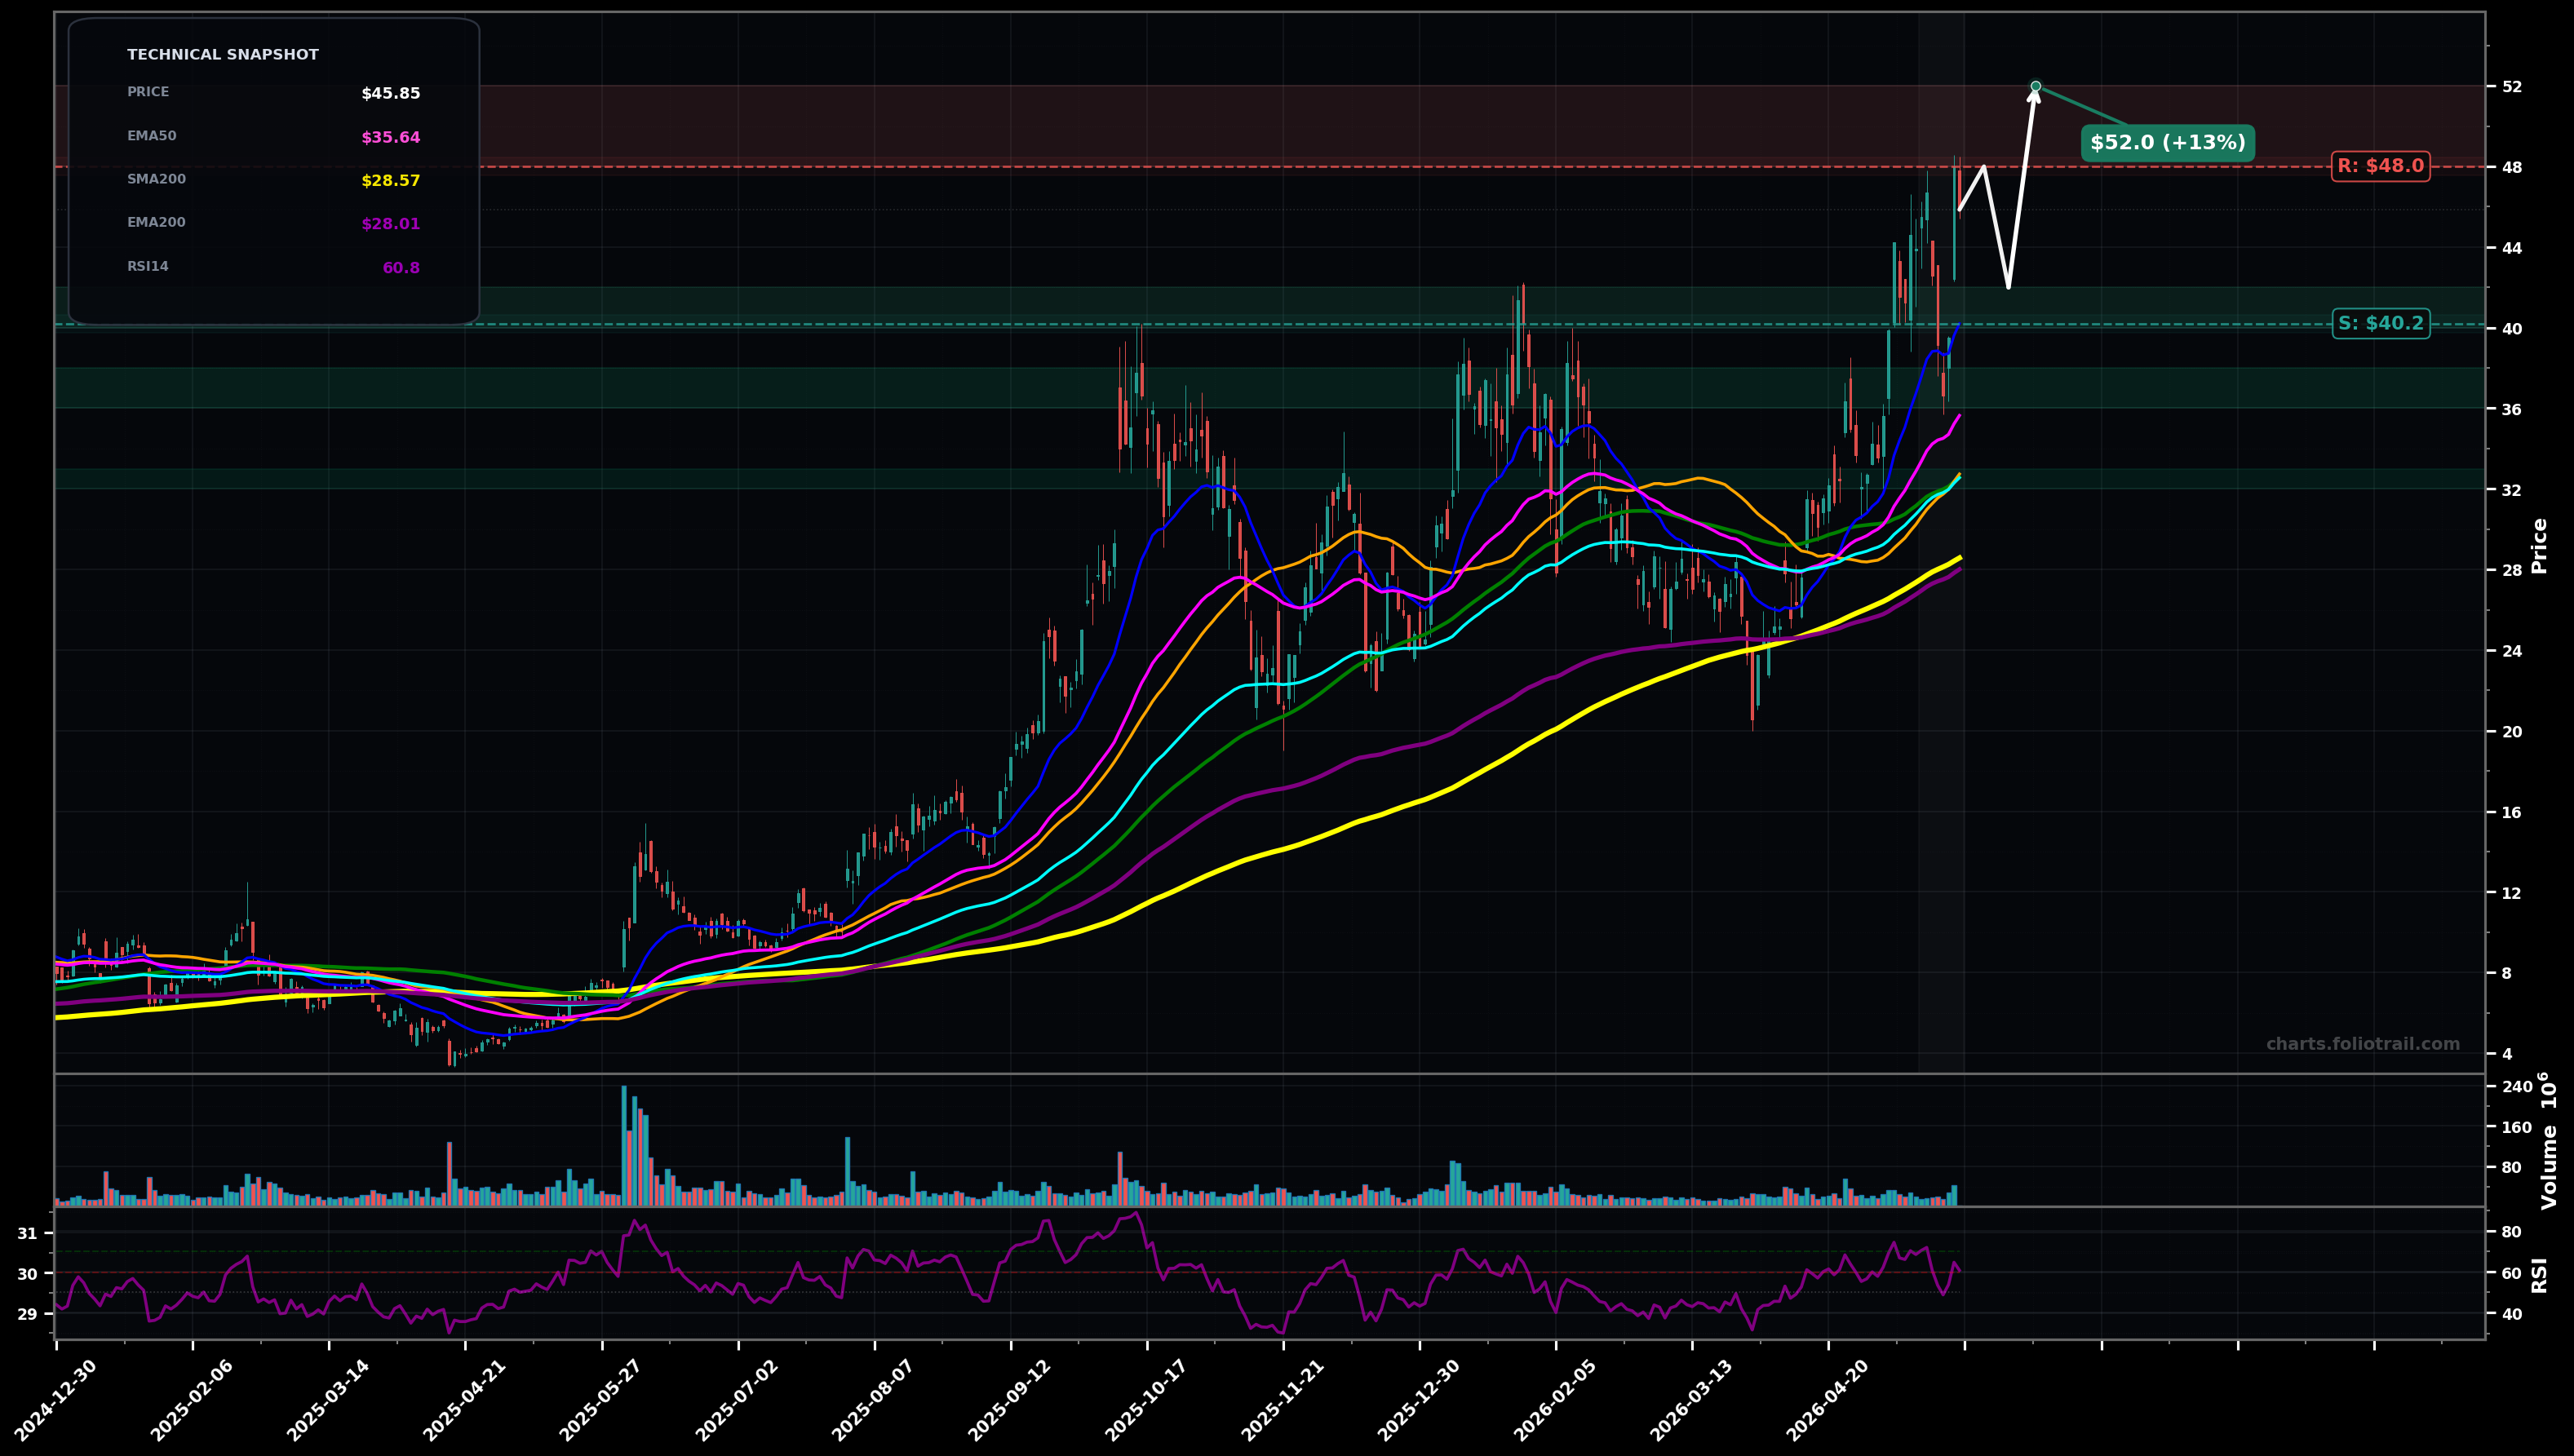
As of May 22, 2026, APLD (Applied Digital Corporation) is in a uptrend state on the daily chart, with a confidence level of 74%. Key support is at $40.2 and key resistance at $48.0. Strong breakout continuation to new swing highs; price $45.85 is well above rising EMA50/EMA100 with a minor pullback from the peak.
Bullish continuation: consolidation/pullback holds above the $40-$42 area, then a push to retest and break the prior high; volatility stays elevated but trend intact (Elliott: late wave 3 or wave 5 extension).
Deeper wave-4 style correction: price rejects near $48 and mean-reverts toward the rising EMA50/EMA100 cluster; then attempts a base before next leg (Fib: typical 38.2%–50% retrace zone).
2 daily closes above $48.00
Daily close below $40.20 (EMA20 area) followed by a breakdown below $35.60 (EMA50)
Start near EMA20/support pivot; add on EMA50 retest; heavy add near EMA100 + prior breakout shelf where trend must hold to keep HH/HL structure.
Trim into clear extension/ATH breakout zones (likely wave-5 blowoff risk); larger trims/exit if price reaches major fib extensions well above rising long MAs (mean-reversion risk increases).
As of May 22, 2026, APLD (Applied Digital Corporation) is in a uptrend state on the daily chart with 74% confidence. Strong breakout continuation to new swing highs; price $45.85 is well above rising EMA50/EMA100 with a minor pullback from the peak.
On the daily timeframe, APLD has key support at $40.2 and key resistance at $48.0. The most likely scenario (bullish) targets $48.0 and $52.0, with a revert level at $42.0.
APLD (Applied Digital Corporation) is currently classified as uptrend on the daily chart, with 74% confidence. Confirmation requires: 2 daily closes above $48.00 This would be invalidated by: Daily close below $40.20 (EMA20 area) followed by a breakdown below $35.60 (EMA50)
The most likely scenario (bullish) targets $48.0 and $52.0, with a revert level at $42.0. The alternative scenario (bearish) targets $37.5 and $32.5.
Multi-layer AI agents analyse 200+ stocks across daily, weekly, and monthly timeframes — producing market state classifications, price scenarios with targets, and position entry/exit levels. Daily charts updated every trading day at 6 PM ET. Weekly charts refresh Fridays. Monthly charts refresh on the last trading day of each month. No paywall. No sign-up required.
Built by Foliotrail.
All content on this website — including charts, analysis, price targets, support/resistance levels, and position zones — is generated entirely by AI and provided for educational and informational purposes only.
This is not financial advice. NEXUSNOIR VENTURES SL (the operator of this website) is not a registered investment adviser or broker-dealer. You should not make investment decisions based solely on this information. Always do your own research and consult a qualified financial advisor.
By continuing, you acknowledge that you have read and agree to our full disclaimer & terms of use and privacy policy.