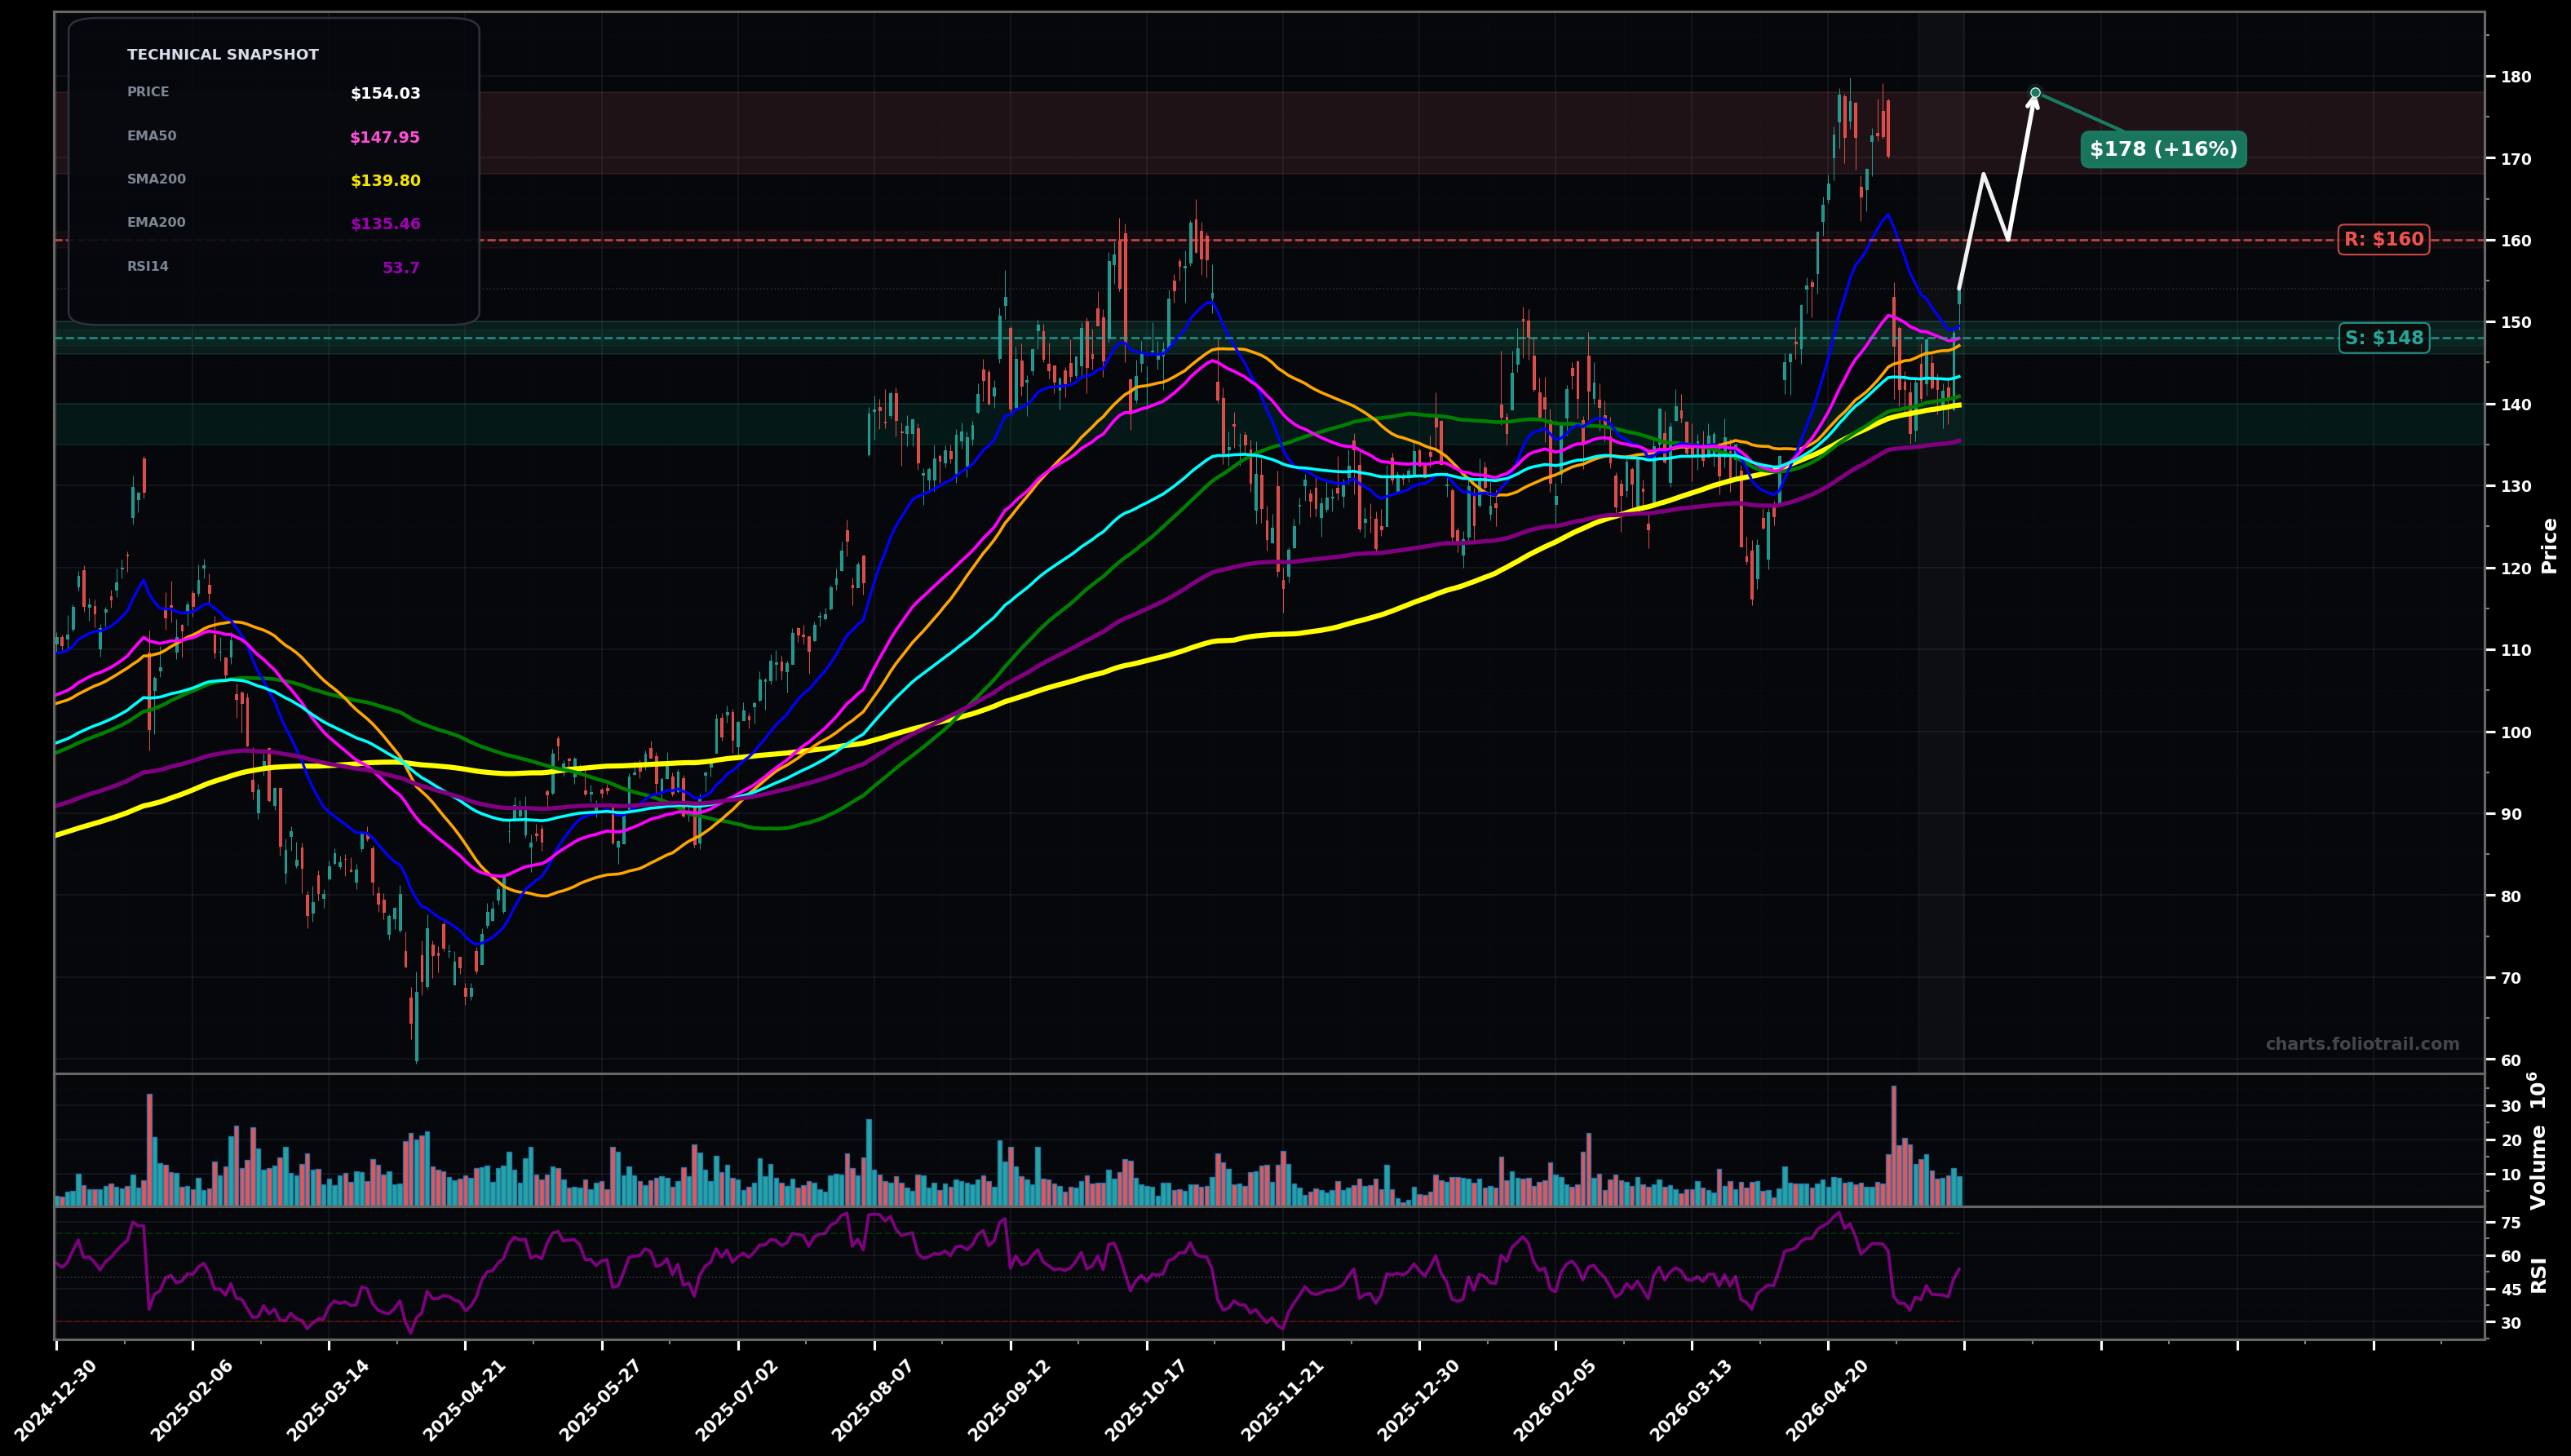
As of May 22, 2026, ANET (Arista Networks, Inc.) is in a uptrend state on the daily chart, with a confidence level of 67%. Key support is at $148 and key resistance at $160. Sharp breakout run to ~$178 then pullback; price now ~$154 holding above rising EMA50 (~$148) with RSI ~54 (cooling, not oversold).
Bullish continuation: pullback completes as a Wave 4-style consolidation (post-breakout), holds EMA50, then pushes through ~$160 to retest the recent supply zone; Fibonacci of the breakout leg implies a typical shallow retrace (roughly 23.6–38.2%) already in progress with support near the EMA cluster.
Deeper corrective reset: rejection near ~$160 persists and price slides to the prior base/MA confluence (EMA100 + SMA100/200 region). This would fit an Elliott Wave larger Wave 4/ABC that undercuts the breakout pivot before attempting a new advance.
Daily close back above ~$160 and then a higher high above ~$168
Daily close below ~$143 (loss of EMA100 + prior breakout area)
Start near EMA50 support; add on EMA100/structure retest; heavy add only at SMA200/EMA200 + prior base support if a deeper Wave-4/ABC plays out.
Trim into prior high/supply (~$178) and any extension; increase trimming on a breakout overshoot; fully close only if price becomes multi-year stretched well above the MA stack (parabolic-style extension).
As of May 22, 2026, ANET (Arista Networks, Inc.) is in a uptrend state on the daily chart with 67% confidence. Sharp breakout run to ~$178 then pullback; price now ~$154 holding above rising EMA50 (~$148) with RSI ~54 (cooling, not oversold).
On the daily timeframe, ANET has key support at $148 and key resistance at $160. The most likely scenario (bullish) targets $168 and $178, with a revert level at $160.
ANET (Arista Networks, Inc.) is currently classified as uptrend on the daily chart, with 67% confidence. Confirmation requires: Daily close back above ~$160 and then a higher high above ~$168 This would be invalidated by: Daily close below ~$143 (loss of EMA100 + prior breakout area)
The most likely scenario (bullish) targets $168 and $178, with a revert level at $160. The alternative scenario (bearish) targets $143 and $140.
Multi-layer AI agents analyse 200+ stocks across daily, weekly, and monthly timeframes — producing market state classifications, price scenarios with targets, and position entry/exit levels. Daily charts updated every trading day at 6 PM ET. Weekly charts refresh Fridays. Monthly charts refresh on the last trading day of each month. No paywall. No sign-up required.
Built by Foliotrail.
All content on this website — including charts, analysis, price targets, support/resistance levels, and position zones — is generated entirely by AI and provided for educational and informational purposes only.
This is not financial advice. NEXUSNOIR VENTURES SL (the operator of this website) is not a registered investment adviser or broker-dealer. You should not make investment decisions based solely on this information. Always do your own research and consult a qualified financial advisor.
By continuing, you acknowledge that you have read and agree to our full disclaimer & terms of use and privacy policy.