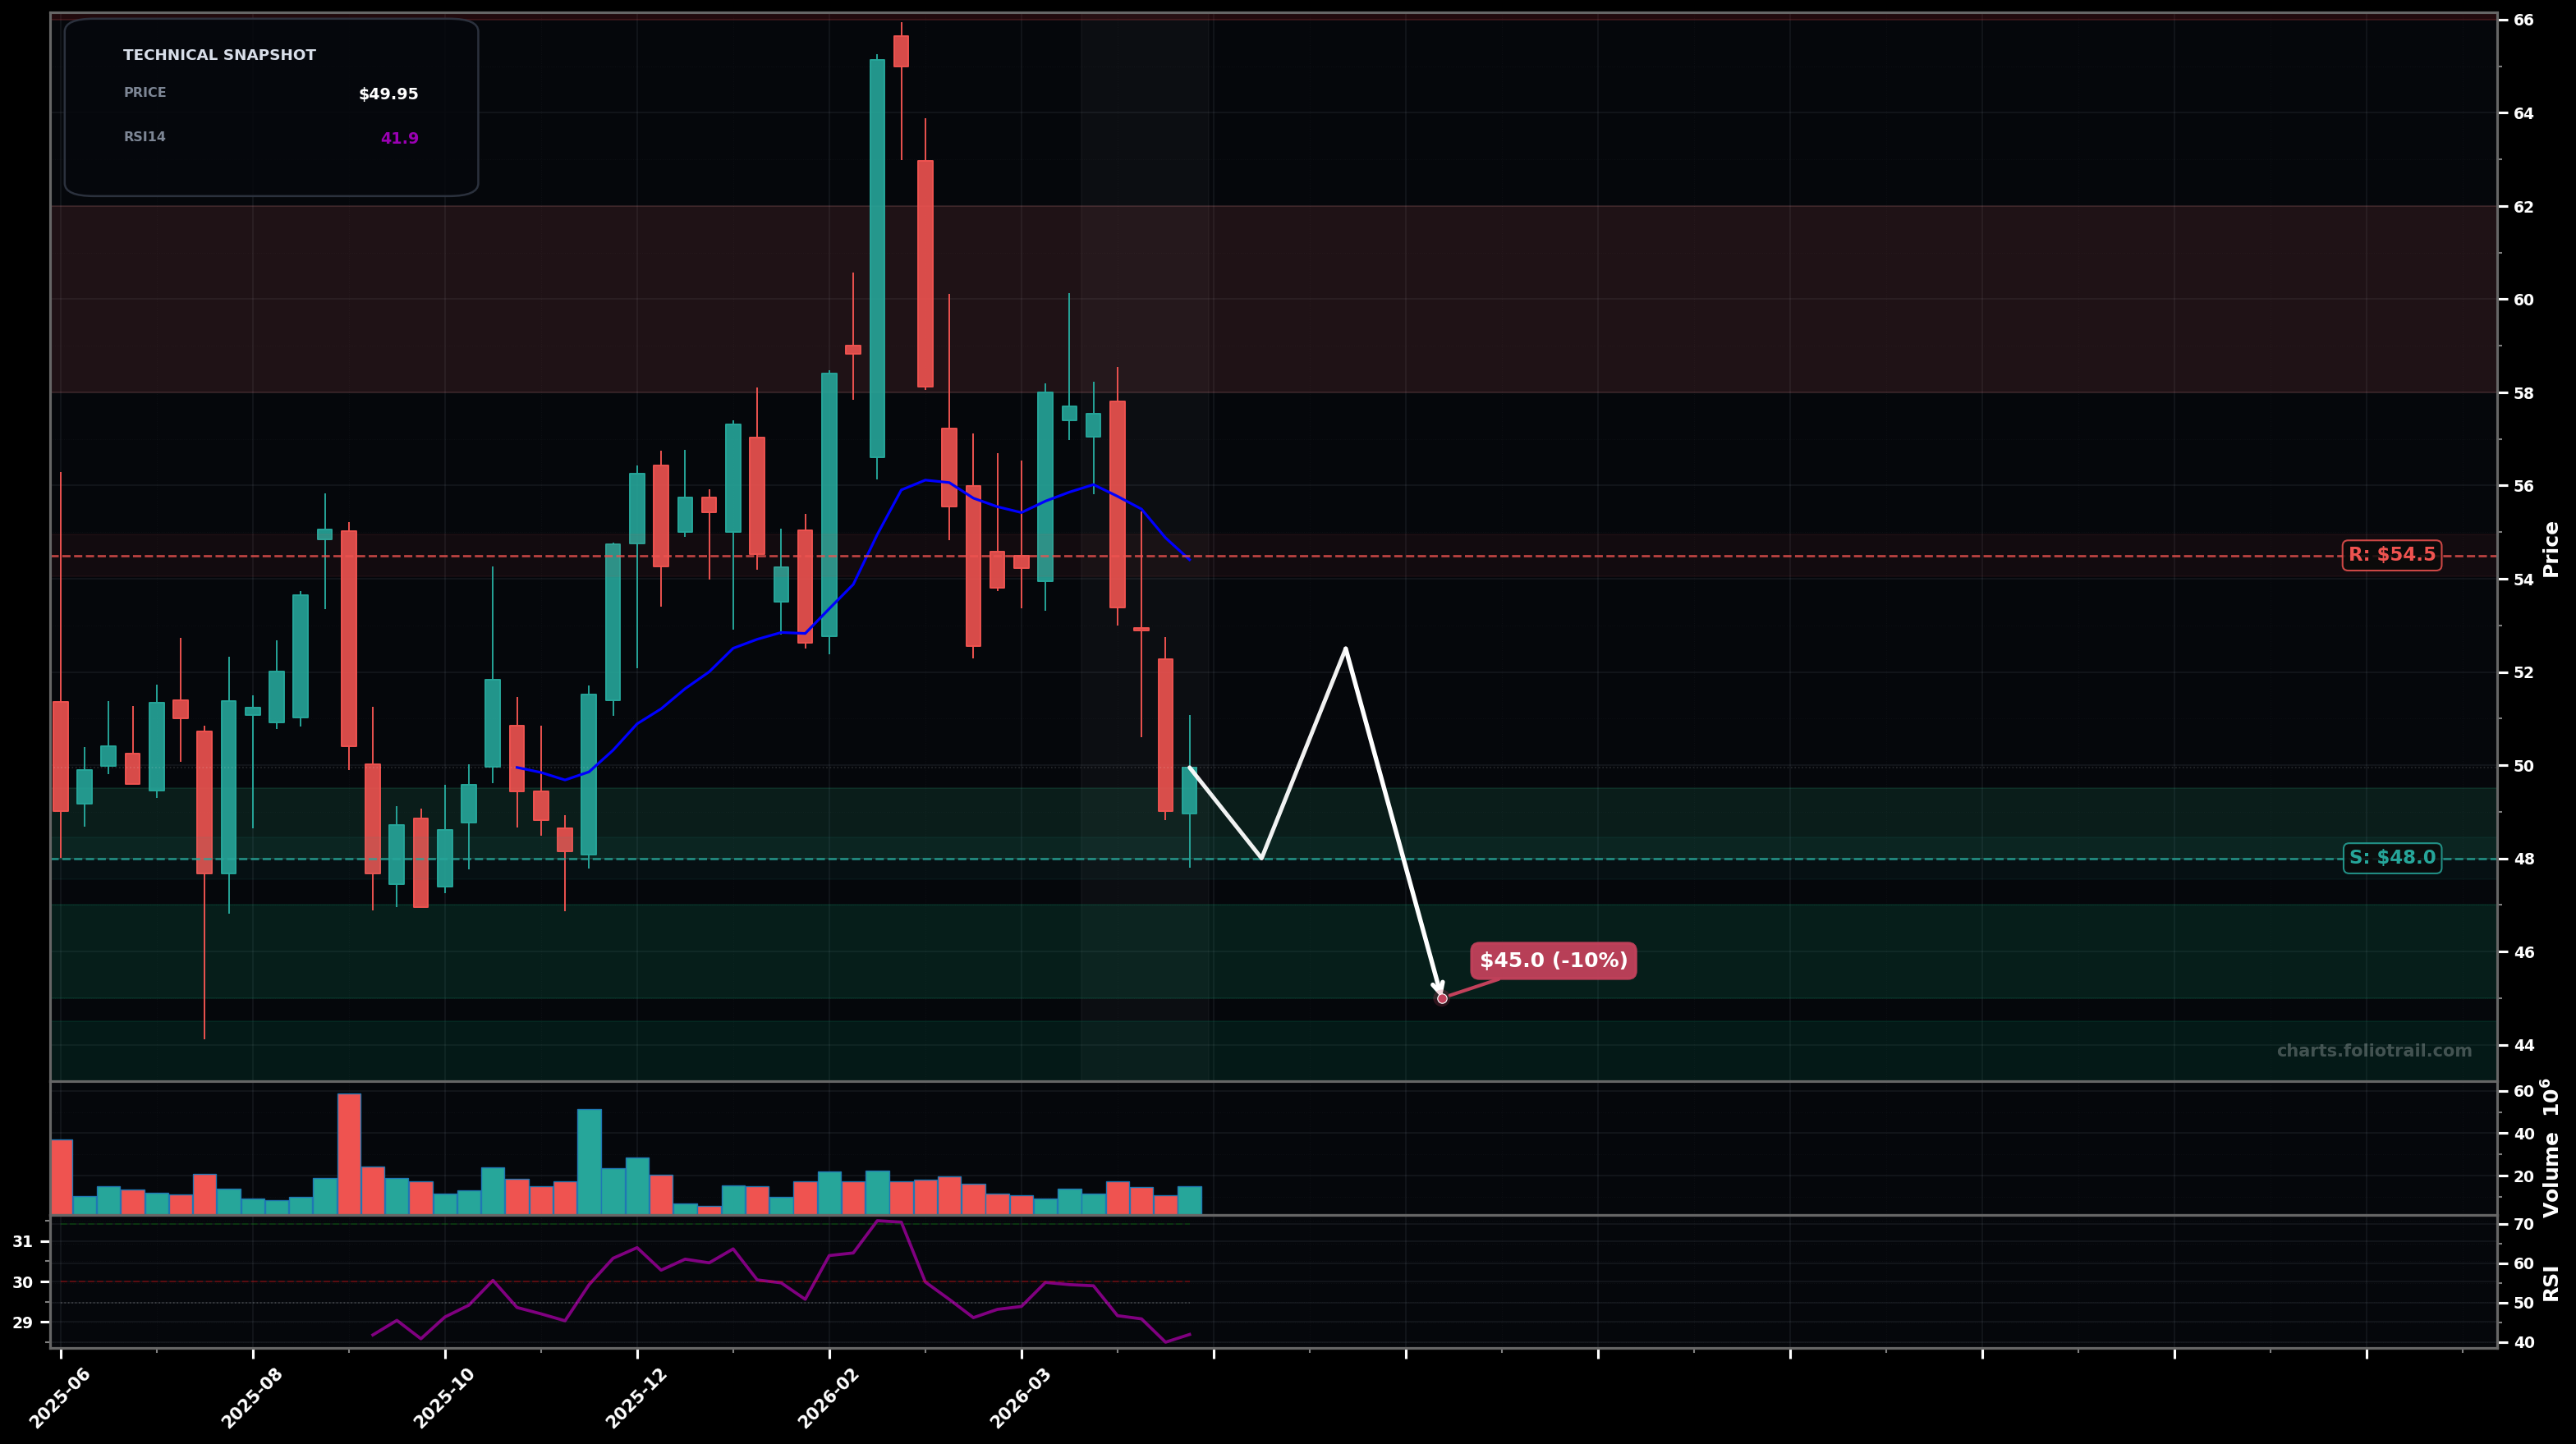
As of May 22, 2026, AMRZ (Amrize Ltd) is in a downtrend state on the weekly chart, with a confidence level of 72%. Key support is at $48.0 and key resistance at $54.5. Weekly price sold off hard from the ~$58 area into ~$49-$50, staying below the falling short-term EMA (shown EMA20 ~$54.4) with RSI-14 ~42 (weak momentum).
Bearish continuation: weak bounce into ~$52-$54 gets rejected (retest of breakdown / EMA area), then price grinds down to retest the $48 support and potentially flushes to the mid-$40s. Rough probability: 60%.
Bullish stabilization / early reversal: price holds $48, forms a higher low (HL) and reclaims the ~$54.5 zone, then mean-reverts toward prior congestion in the upper-$50s. Rough probability: 40%.
Weekly close below $48.00 (break of the current swing-low area) would confirm further downside risk.
Weekly close back above $54.50 with follow-through would invalidate the immediate downtrend pressure.
Start near the current swing-low support (~$48) and add heavier only on deeper pullbacks toward prior base/lows (~$45 then low-$40s) unless price first reclaims $54.5 (trend improvement).
Trim into prior supply zones (upper-$50s to low-$60s) and exit into a full retest/extension beyond the prior peak region (~$65+) where a larger Elliott Wave top / fib extension risk increases.
As of May 22, 2026, AMRZ (Amrize Ltd) is in a downtrend state on the weekly chart with 72% confidence. Weekly price sold off hard from the ~$58 area into ~$49-$50, staying below the falling short-term EMA (shown EMA20 ~$54.4) with RSI-14 ~42 (weak momentum).
On the weekly timeframe, AMRZ has key support at $48.0 and key resistance at $54.5. The most likely scenario (bearish) targets $48.0 and $45.0, with a revert level at $52.5.
AMRZ (Amrize Ltd) is currently classified as downtrend on the weekly chart, with 72% confidence. Confirmation requires: Weekly close below $48.00 (break of the current swing-low area) would confirm further downside risk. This would be invalidated by: Weekly close back above $54.50 with follow-through would invalidate the immediate downtrend pressure.
The most likely scenario (bearish) targets $48.0 and $45.0, with a revert level at $52.5. The alternative scenario (bullish) targets $54.5 and $58.0.
Multi-layer AI agents analyse 200+ stocks across daily, weekly, and monthly timeframes — producing market state classifications, price scenarios with targets, and position entry/exit levels. Daily charts updated every trading day at 6 PM ET. Weekly charts refresh Fridays. Monthly charts refresh on the last trading day of each month. No paywall. No sign-up required.
Built by Foliotrail.
All content on this website — including charts, analysis, price targets, support/resistance levels, and position zones — is generated entirely by AI and provided for educational and informational purposes only.
This is not financial advice. NEXUSNOIR VENTURES SL (the operator of this website) is not a registered investment adviser or broker-dealer. You should not make investment decisions based solely on this information. Always do your own research and consult a qualified financial advisor.
By continuing, you acknowledge that you have read and agree to our full disclaimer & terms of use and privacy policy.