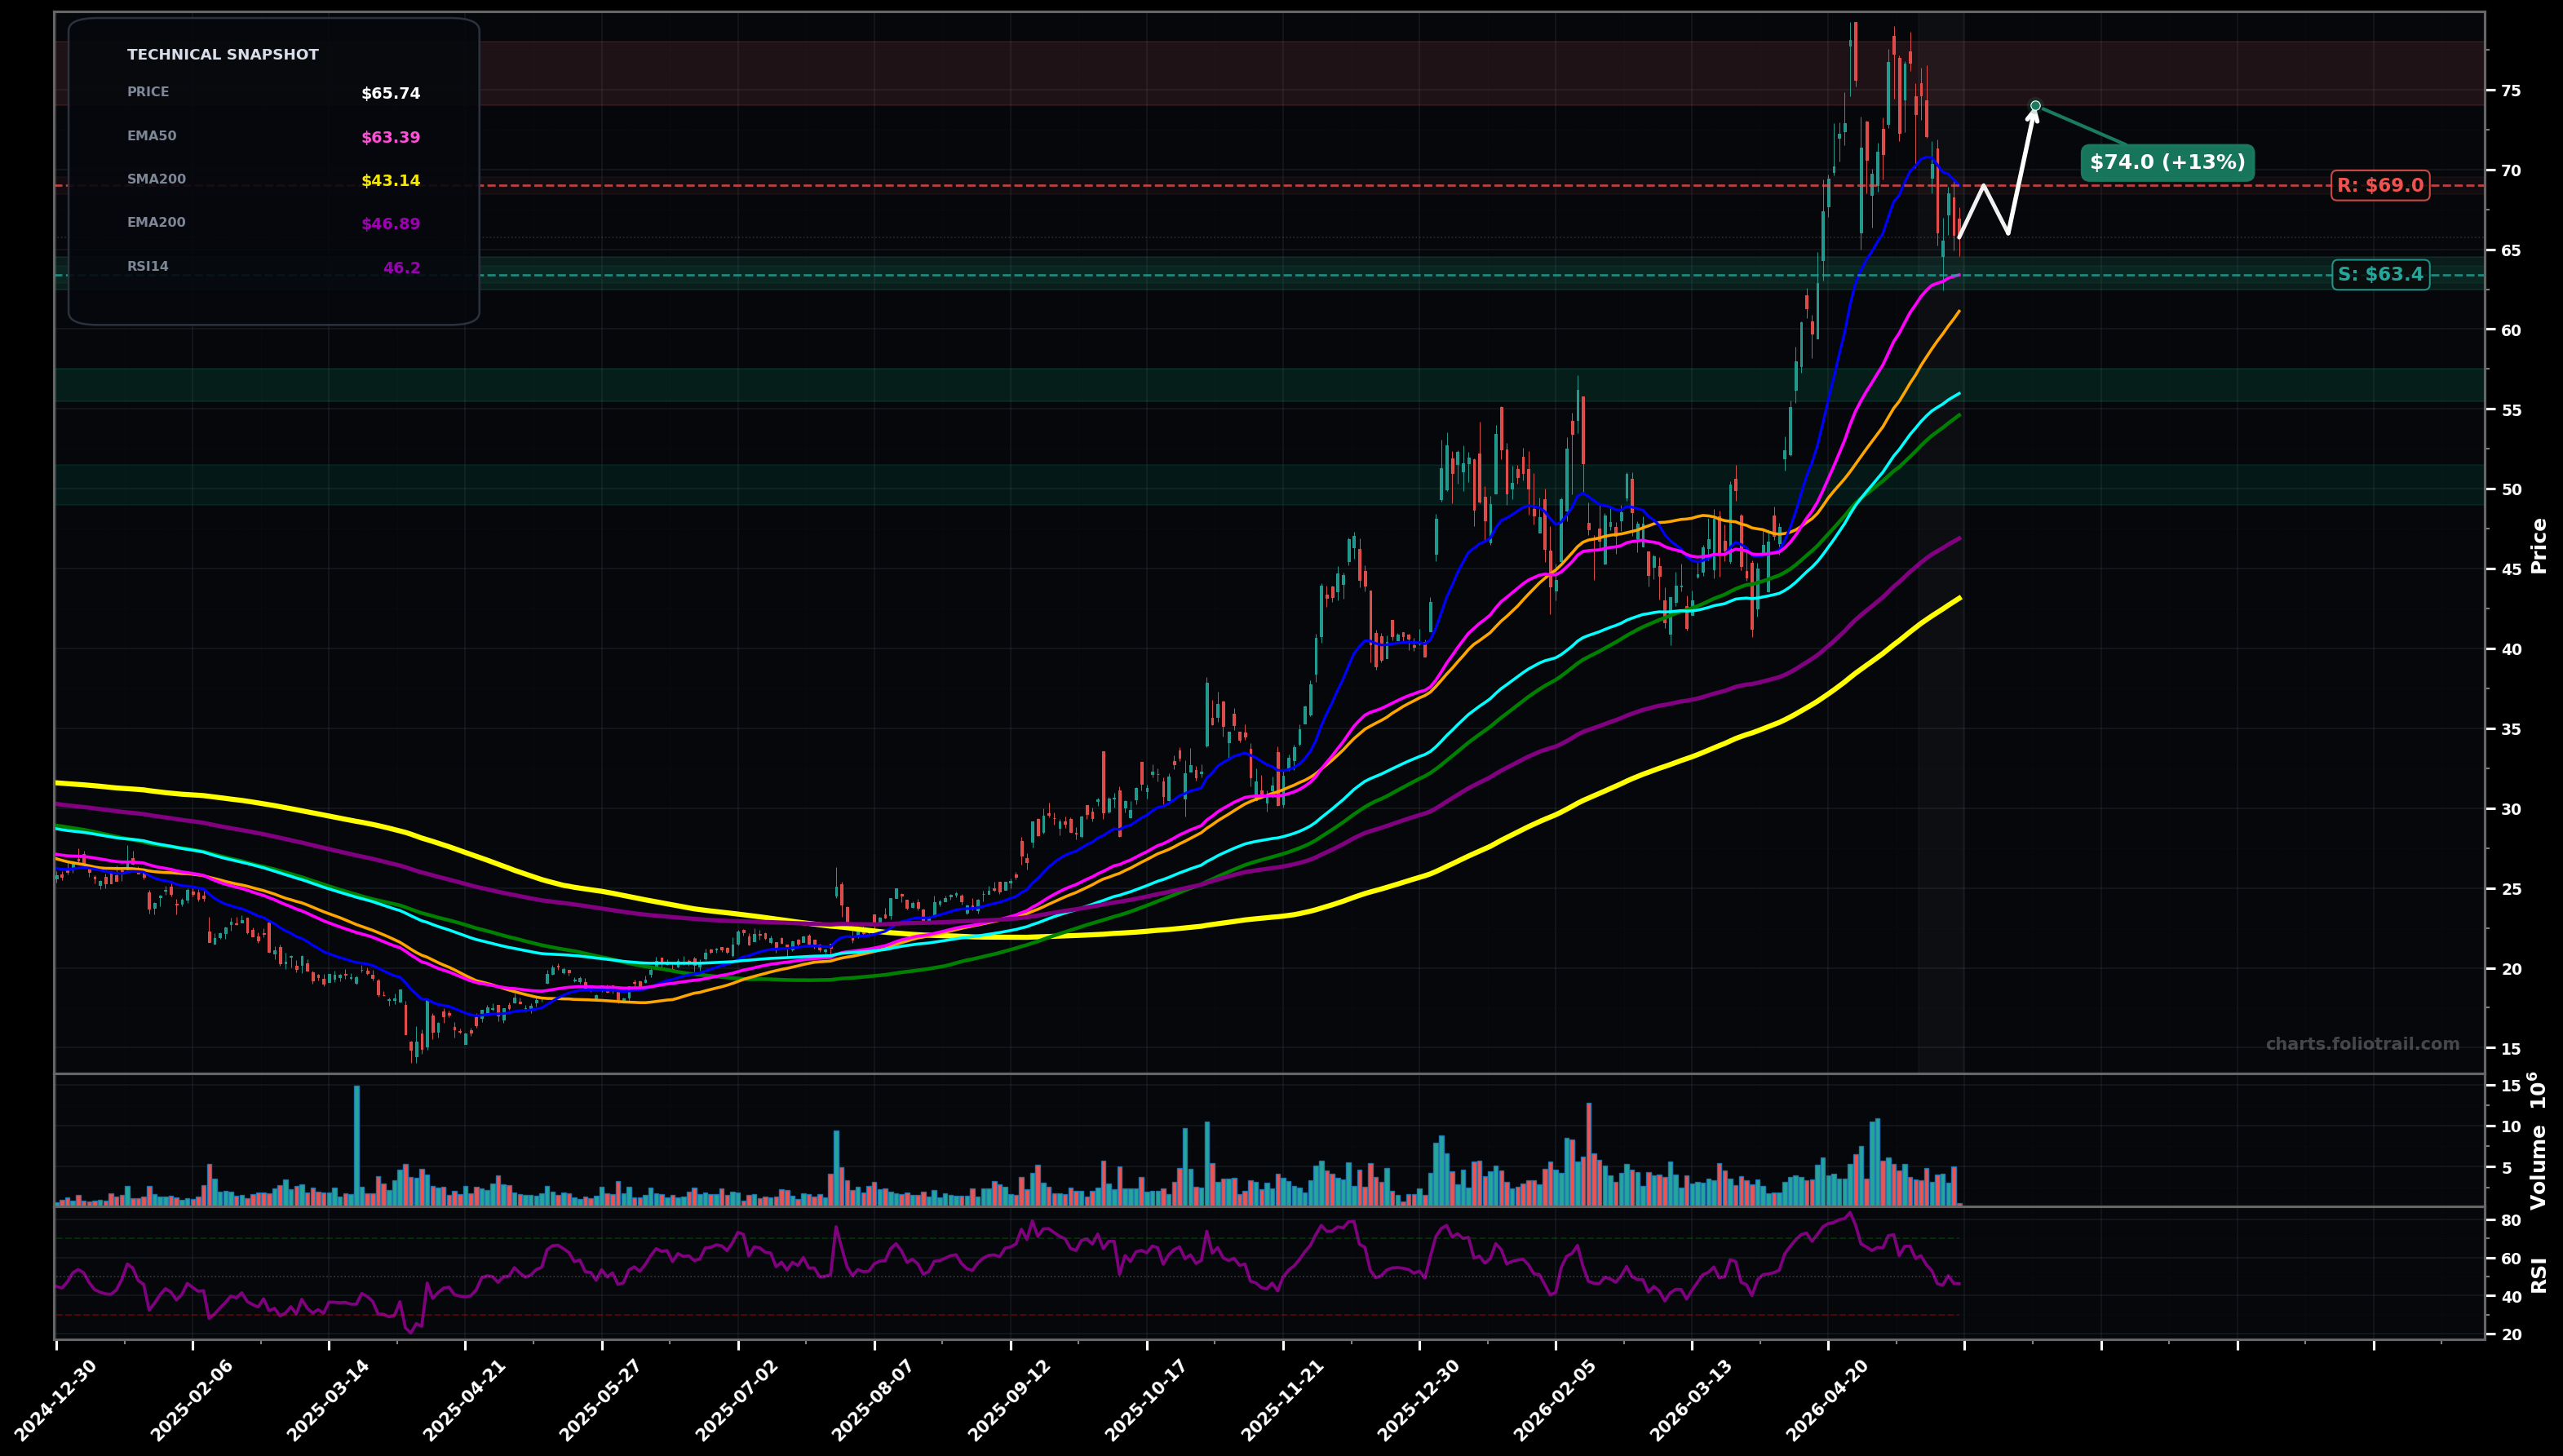
As of May 22, 2026, AMKR (Amkor Technology Inc.) is in a bottoming attempt state on the daily chart, with a confidence level of 62%. Key support is at $63.4 and key resistance at $69.0. Sharp pullback from the ~$78 peak; price ~$65.74 is below EMA20 (~$69) and sitting just above EMA50 (~$63.39) after multiple red candles; RSI ~46 (cooling momentum).
Base/rebound off the EMA50 area: buyers defend ~$63-$64, price reclaims EMA20 and grinds back toward the prior breakdown zone, with a possible retest/pullback before pushing higher.
Support fails: decisive break below EMA50 triggers a deeper ABC-style correction/mean reversion toward EMA100 and the prior consolidation band; rally attempts get sold under reclaimed resistance.
2+ daily closes back above $69.00 (EMA20) would confirm a rebound leg from support.
Daily close below $63.00 would invalidate the bottoming attempt and shift risk to deeper mean-reversion.
Start near rising EMA50/support confluence; add at EMA100 (~$55.97)/former structure; heavy add near SMA50/round-number support and likely Fib retrace completion zone.
Trim into prior peak supply ($74-$78); heavier trims on a renewed extension where price is stretched far above EMA50/EMA100; close into an overshoot zone consistent with a late Elliott wave extension beyond prior highs.
As of May 22, 2026, AMKR (Amkor Technology Inc.) is in a bottoming attempt state on the daily chart with 62% confidence. Sharp pullback from the ~$78 peak; price ~$65.74 is below EMA20 (~$69) and sitting just above EMA50 (~$63.39) after multiple red candles; RSI ~46 (cooling momentum).
On the daily timeframe, AMKR has key support at $63.4 and key resistance at $69.0. The most likely scenario (bullish) targets $69.0 and $74.0, with a revert level at $66.0.
AMKR (Amkor Technology Inc.) is currently classified as bottoming attempt on the daily chart, with 62% confidence. Confirmation requires: 2+ daily closes back above $69.00 (EMA20) would confirm a rebound leg from support. This would be invalidated by: Daily close below $63.00 would invalidate the bottoming attempt and shift risk to deeper mean-reversion.
The most likely scenario (bullish) targets $69.0 and $74.0, with a revert level at $66.0. The alternative scenario (bearish) targets $56.0 and $50.0.
Multi-layer AI agents analyse 200+ stocks across daily, weekly, and monthly timeframes — producing market state classifications, price scenarios with targets, and position entry/exit levels. Daily charts updated every trading day at 6 PM ET. Weekly charts refresh Fridays. Monthly charts refresh on the last trading day of each month. No paywall. No sign-up required.
Built by Foliotrail.
All content on this website — including charts, analysis, price targets, support/resistance levels, and position zones — is generated entirely by AI and provided for educational and informational purposes only.
This is not financial advice. NEXUSNOIR VENTURES SL (the operator of this website) is not a registered investment adviser or broker-dealer. You should not make investment decisions based solely on this information. Always do your own research and consult a qualified financial advisor.
By continuing, you acknowledge that you have read and agree to our full disclaimer & terms of use and privacy policy.