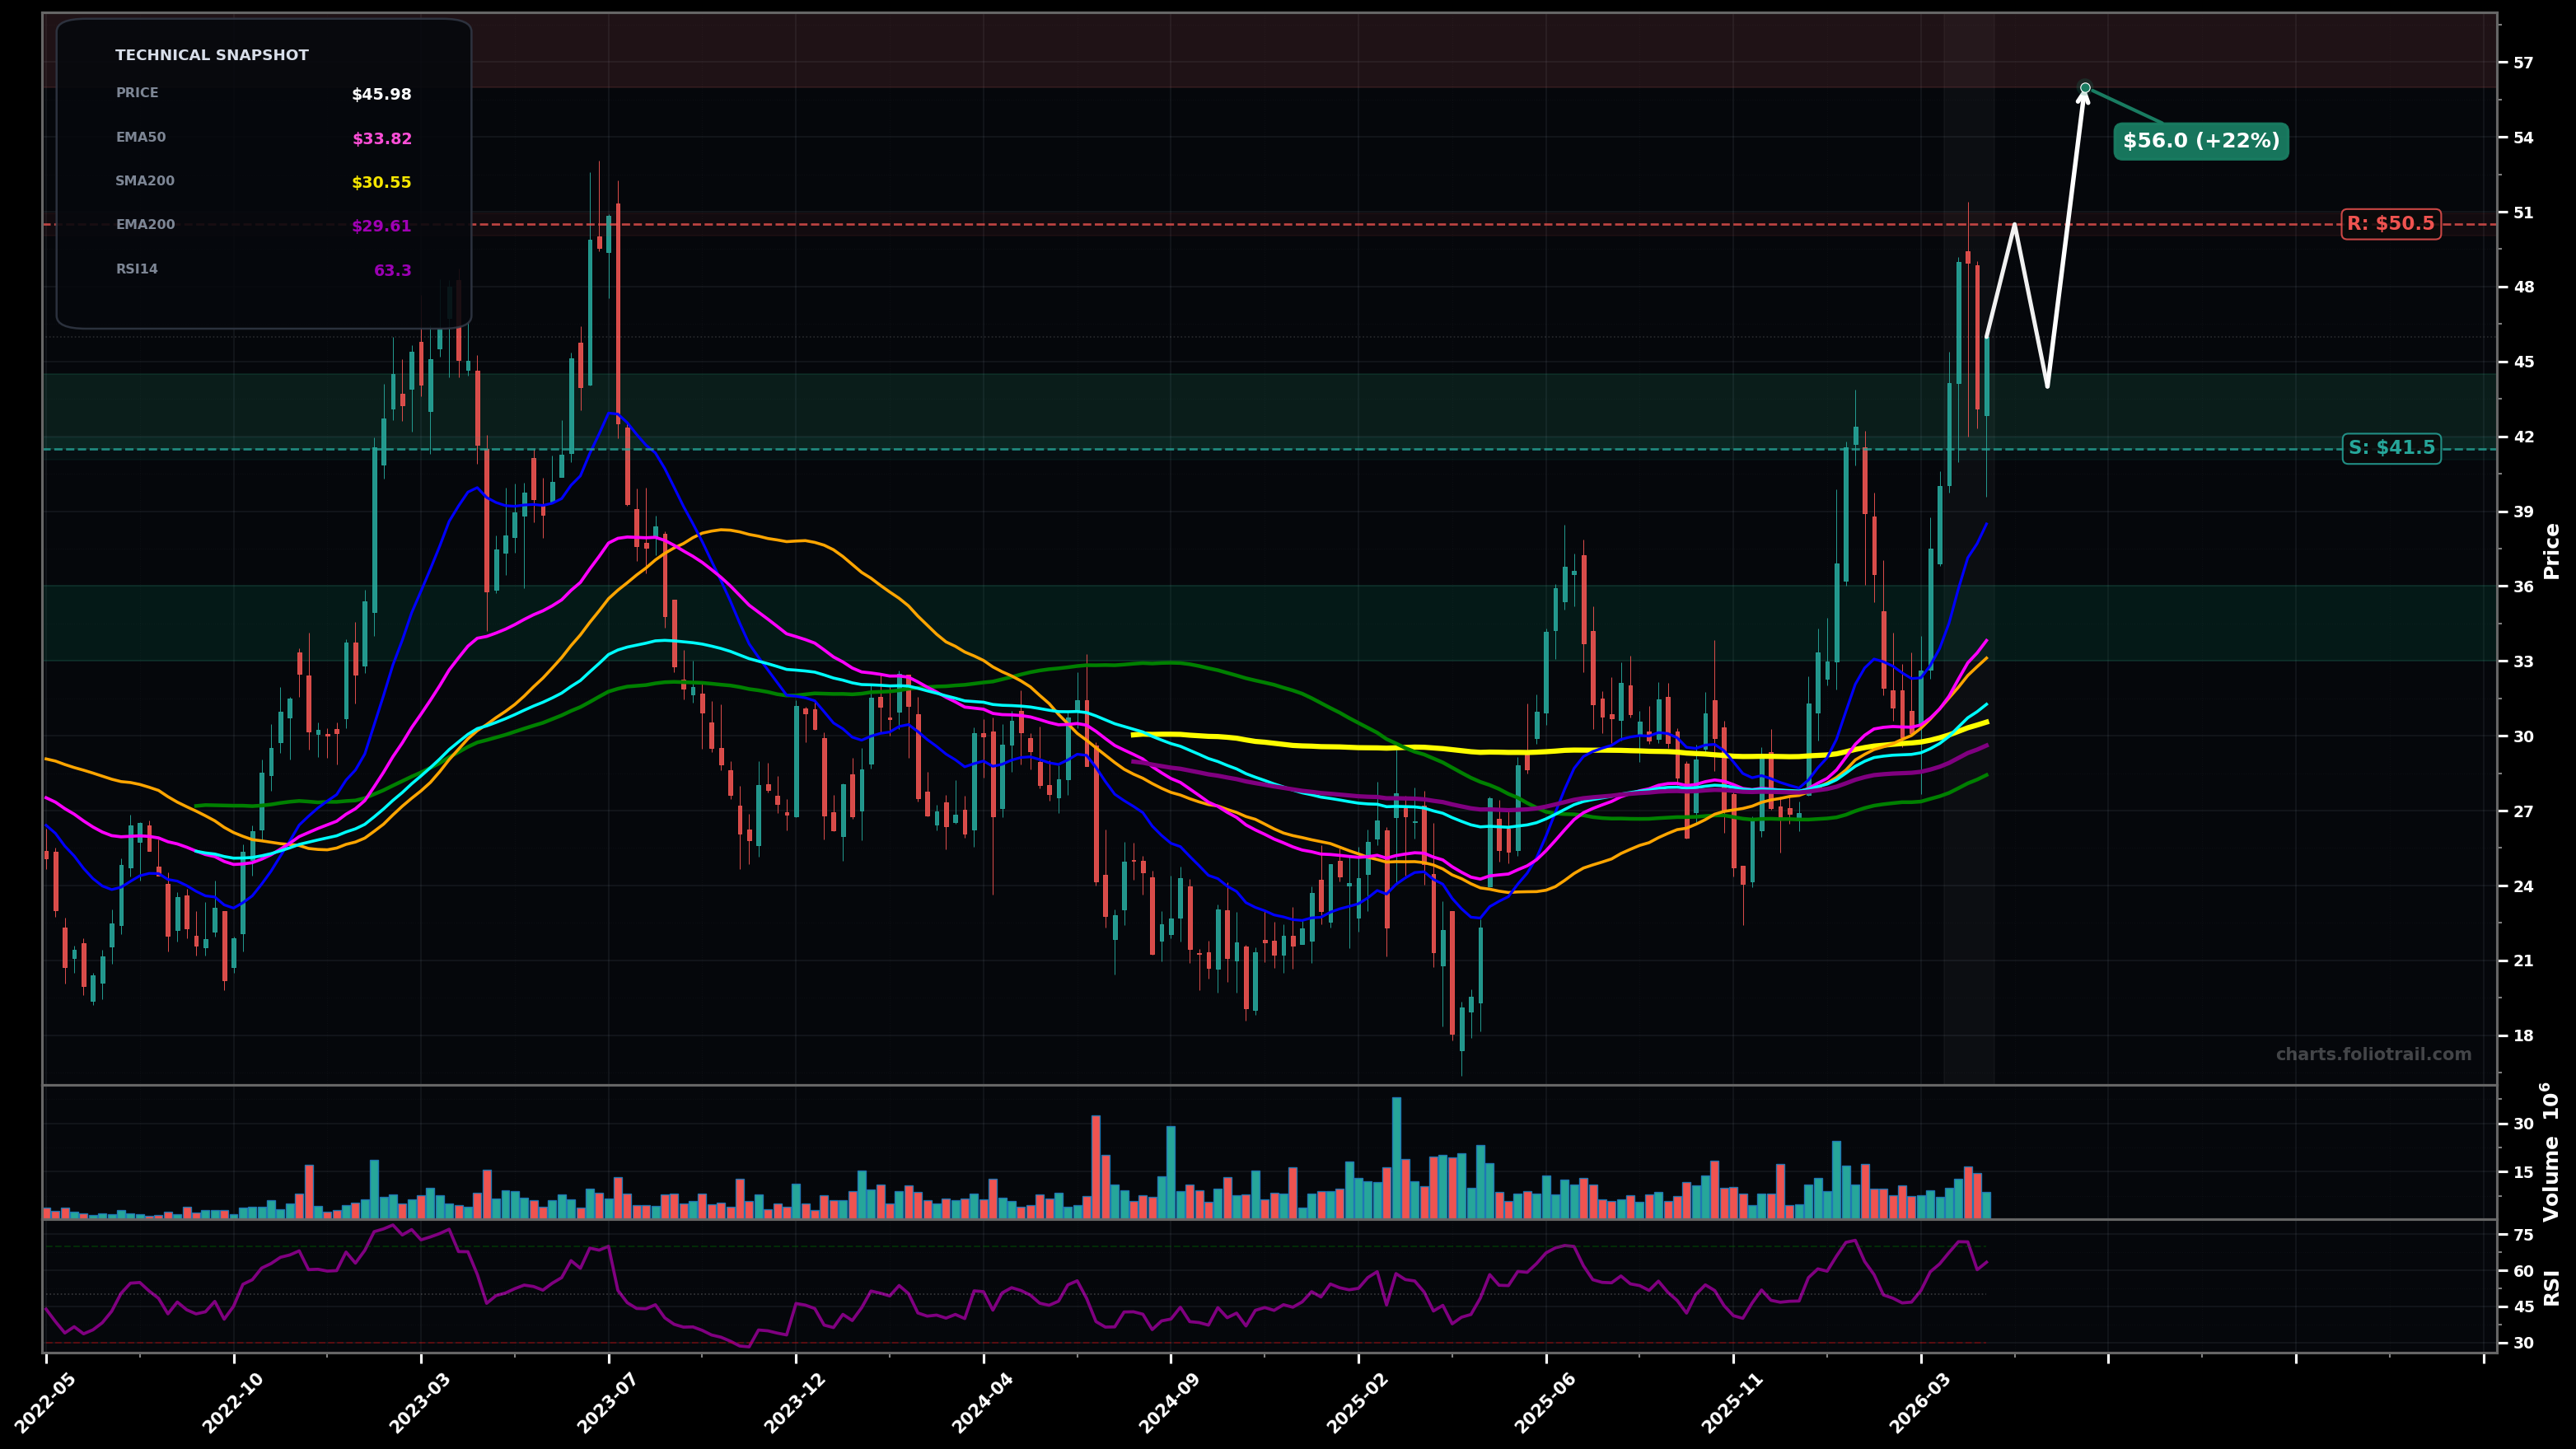
As of May 22, 2026, ALGM (Allegro MicroSystems, Inc.) is in a uptrend state on the weekly chart, with a confidence level of 72%. Key support is at $41.5 and key resistance at $50.5. Weekly uptrend continuation; sharp push to ~$50 followed by pullback/consolidation, still holding above rising EMA20/EMA50 cluster; RSI ~63 (bullish but not extreme).
Bullish continuation: pullback stays shallow (above EMA20/EMA50 area) then price reclaims ~$49-$50 and retests the recent high; if it clears, extension leg resumes.
Deeper correction: rejection under ~$50 leads to a larger ABC pullback toward the breakout/MA cluster; buyers defend the $38-$40 zone and attempt another base-to-breakout.
Weekly close back above $49.50 (reclaim of the recent pullback pivot) would confirm continuation toward the prior high.
Weekly close below $41.50 (loss of the most recent swing low reference / breakdown back into the MA band) would invalidate the current uptrend posture.
Start near prior swing support; add on test of breakout retest area; heavy add only if price mean-reverts into the EMA200/SMA50-SMA200 cluster where trend must prove itself again.
Trim into Fibonacci-style extension zones above the ~$50 pivot where upside can get stretched vs the MA stack; progressively reduce as extensions become less sustainable on weekly.
As of May 22, 2026, ALGM (Allegro MicroSystems, Inc.) is in a uptrend state on the weekly chart with 72% confidence. Weekly uptrend continuation; sharp push to ~$50 followed by pullback/consolidation, still holding above rising EMA20/EMA50 cluster; RSI ~63 (bullish but not extreme).
On the weekly timeframe, ALGM has key support at $41.5 and key resistance at $50.5. The most likely scenario (bullish) targets $50.5 and $56.0, with a revert level at $44.0.
ALGM (Allegro MicroSystems, Inc.) is currently classified as uptrend on the weekly chart, with 72% confidence. Confirmation requires: Weekly close back above $49.50 (reclaim of the recent pullback pivot) would confirm continuation toward the prior high. This would be invalidated by: Weekly close below $41.50 (loss of the most recent swing low reference / breakdown back into the MA band) would invalidate the current uptrend posture.
The most likely scenario (bullish) targets $50.5 and $56.0, with a revert level at $44.0. The alternative scenario (bearish) targets $40.0 and $34.0.
Multi-layer AI agents analyse 200+ stocks across daily, weekly, and monthly timeframes — producing market state classifications, price scenarios with targets, and position entry/exit levels. Daily charts updated every trading day at 6 PM ET. Weekly charts refresh Fridays. Monthly charts refresh on the last trading day of each month. No paywall. No sign-up required.
Built by Foliotrail.
All content on this website — including charts, analysis, price targets, support/resistance levels, and position zones — is generated entirely by AI and provided for educational and informational purposes only.
This is not financial advice. NEXUSNOIR VENTURES SL (the operator of this website) is not a registered investment adviser or broker-dealer. You should not make investment decisions based solely on this information. Always do your own research and consult a qualified financial advisor.
By continuing, you acknowledge that you have read and agree to our full disclaimer & terms of use and privacy policy.