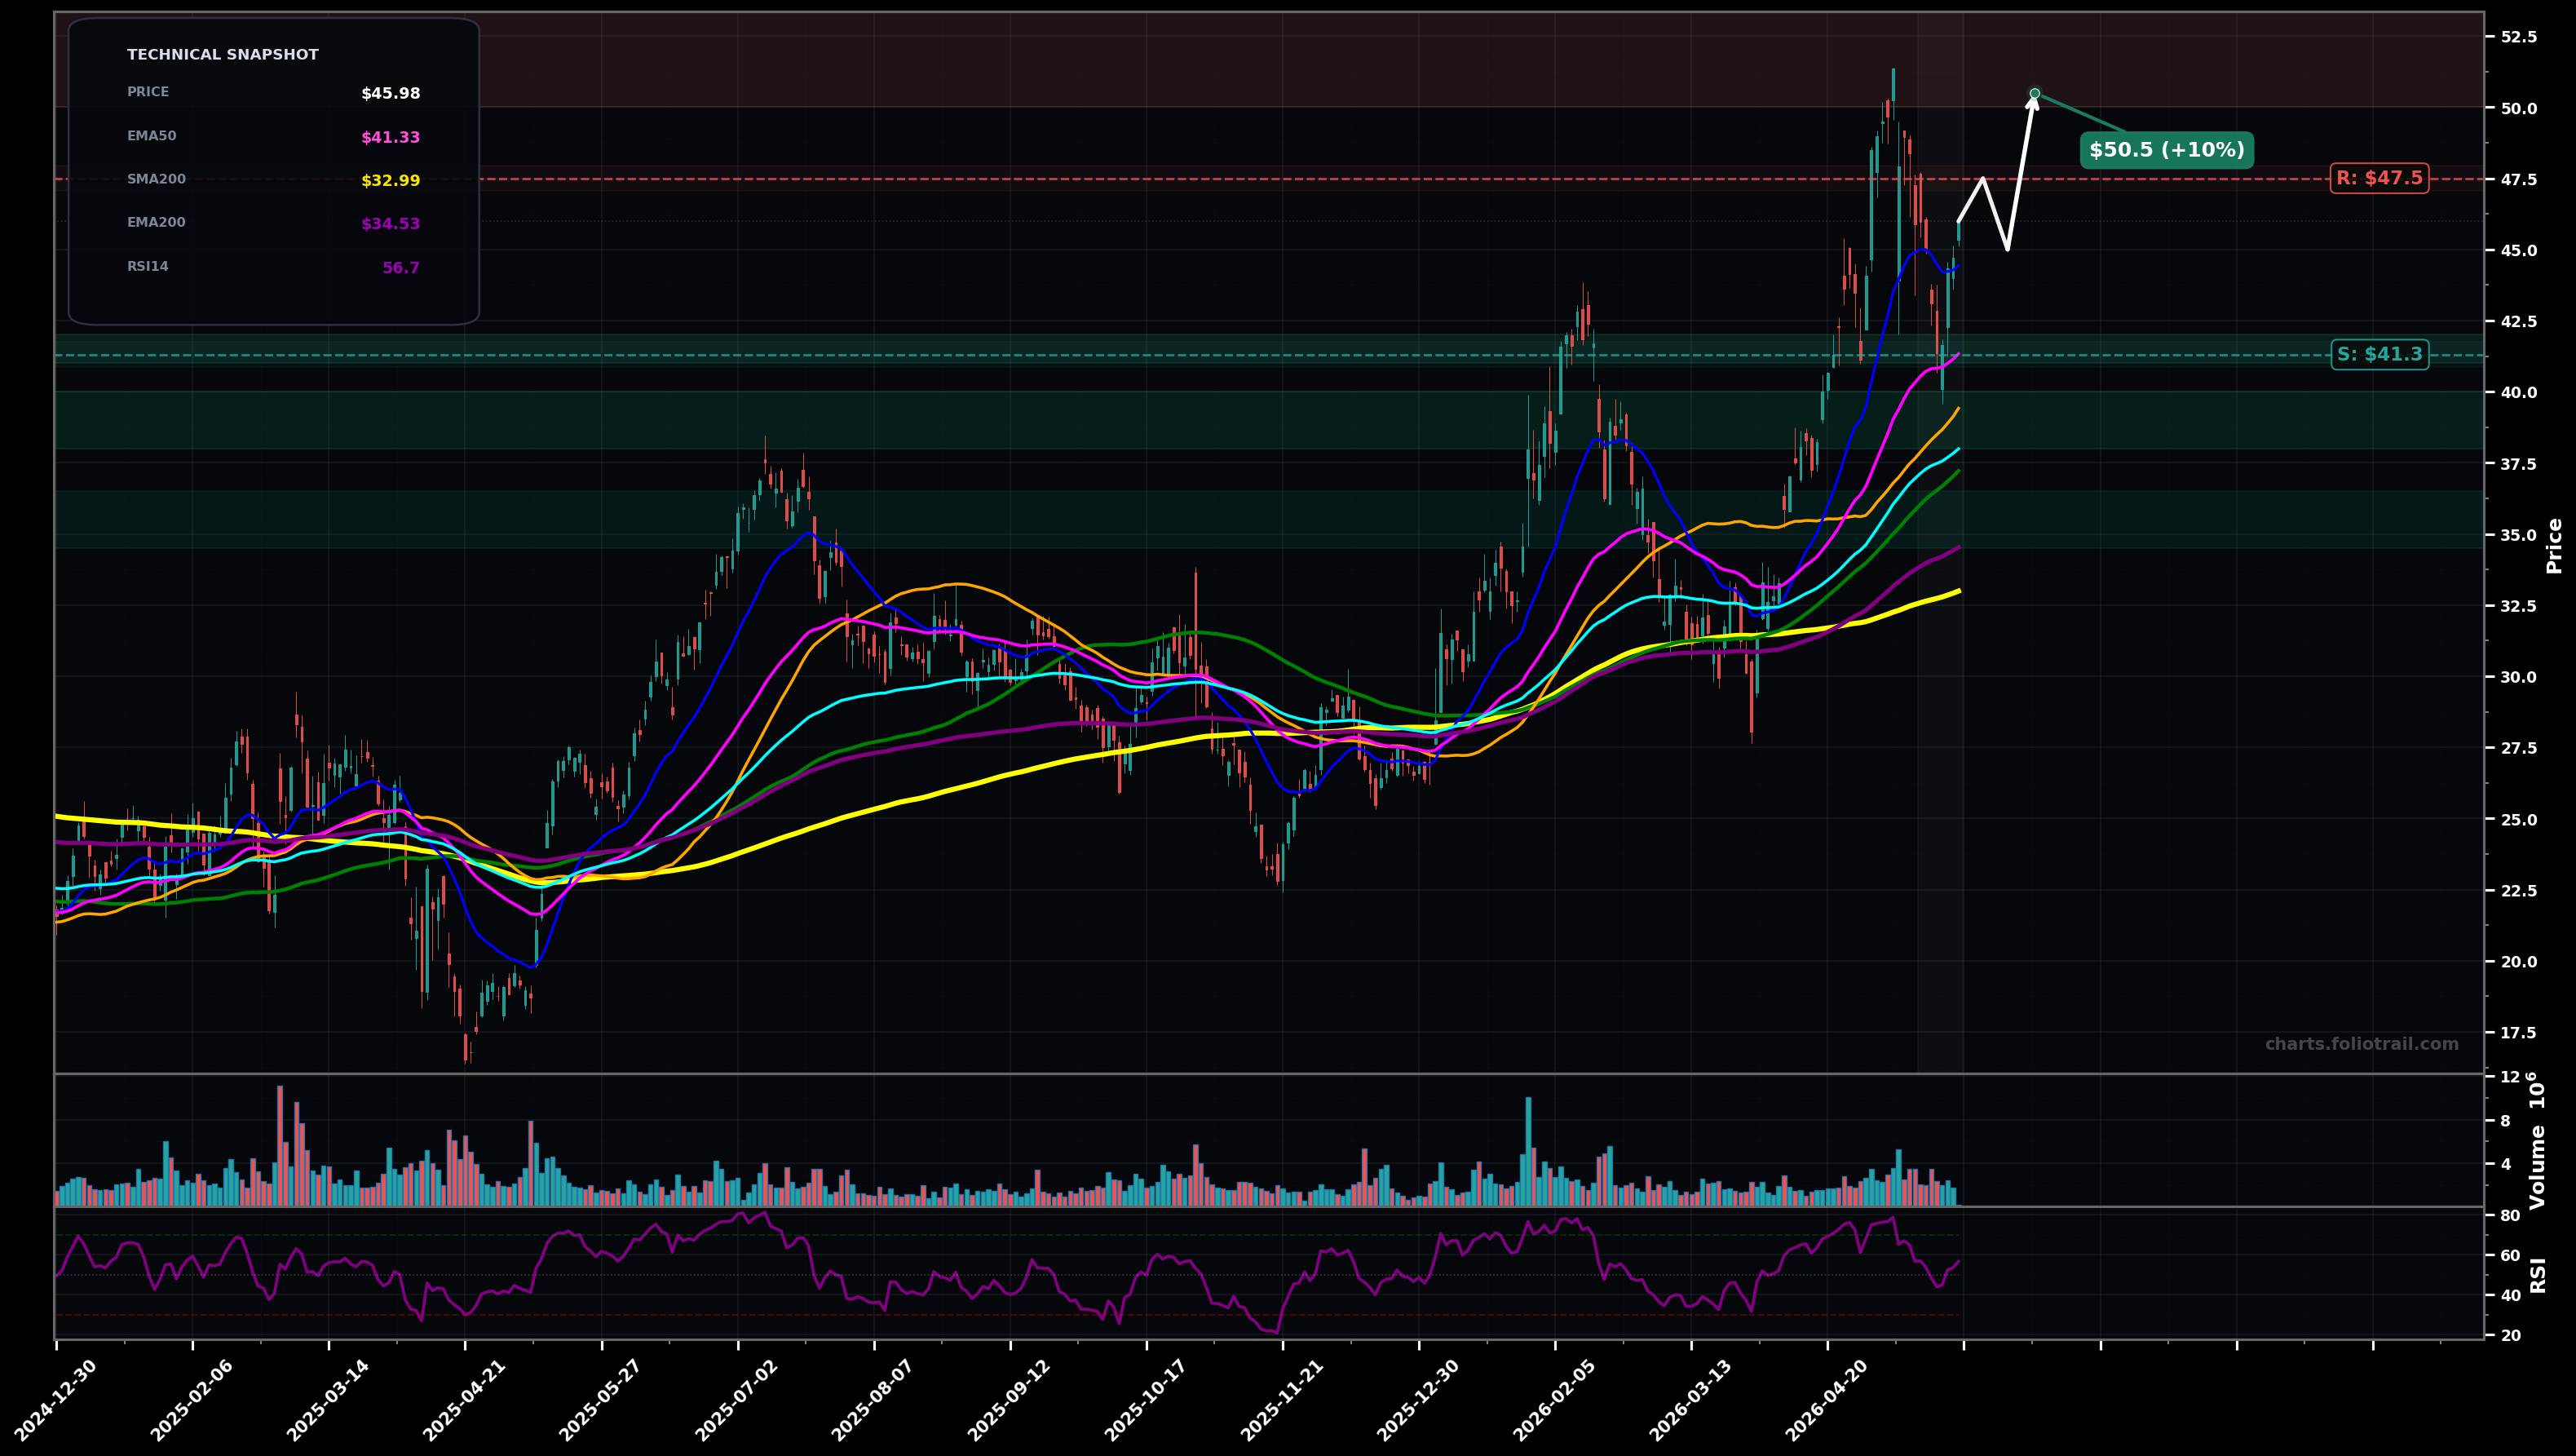
As of May 22, 2026, ALGM (Allegro MicroSystems, Inc.) is in a uptrend state on the daily chart, with a confidence level of 67%. Key support is at $41.3 and key resistance at $47.5. Price at $45.98 is holding above rising EMA50 ($41.33) after a sharp pullback from the ~$50 swing high; momentum recovered to RSI14 ~56.7.
Bullish continuation: pullback completes as a higher low above EMA50, then a push into the prior supply zone with a retest of the breakdown area before attempting the highs. Elliott read: likely wave (4) finished/finishing, starting wave (5) attempt toward prior peak.
Bearish deeper retrace: rejection near $47-$48 leads to a larger wave (4) pullback toward the mid-MA cluster (EMA100/SMA50 area), with buyers defending the prior breakout zone. If lost, risk of a larger mean reversion toward the ~$35-$38 base.
Daily close above $47.50 followed by a second close holding above $47.50.
Daily close below $41.00 (loss of EMA50 support) and failure to reclaim it within the next 2-3 sessions.
Buy-the-dip aligned to EMA50 first, then EMA100/SMA50 confluence, then EMA200/SMA100 area + prior range support if a deeper wave-(4) retrace occurs.
Trim into prior ATH supply ($50+) and then into successive Fibonacci-extension/impulse-exhaustion zones if price gets increasingly stretched above EMA50/100 with RSI staying elevated.
As of May 22, 2026, ALGM (Allegro MicroSystems, Inc.) is in a uptrend state on the daily chart with 67% confidence. Price at $45.98 is holding above rising EMA50 ($41.33) after a sharp pullback from the ~$50 swing high; momentum recovered to RSI14 ~56.7.
On the daily timeframe, ALGM has key support at $41.3 and key resistance at $47.5. The most likely scenario (bullish) targets $47.5 and $50.5, with a revert level at $45.0.
ALGM (Allegro MicroSystems, Inc.) is currently classified as uptrend on the daily chart, with 67% confidence. Confirmation requires: Daily close above $47.50 followed by a second close holding above $47.50. This would be invalidated by: Daily close below $41.00 (loss of EMA50 support) and failure to reclaim it within the next 2-3 sessions.
The most likely scenario (bullish) targets $47.5 and $50.5, with a revert level at $45.0. The alternative scenario (bearish) targets $41.3 and $38.0.
Multi-layer AI agents analyse 200+ stocks across daily, weekly, and monthly timeframes — producing market state classifications, price scenarios with targets, and position entry/exit levels. Daily charts updated every trading day at 6 PM ET. Weekly charts refresh Fridays. Monthly charts refresh on the last trading day of each month. No paywall. No sign-up required.
Built by Foliotrail.
All content on this website — including charts, analysis, price targets, support/resistance levels, and position zones — is generated entirely by AI and provided for educational and informational purposes only.
This is not financial advice. NEXUSNOIR VENTURES SL (the operator of this website) is not a registered investment adviser or broker-dealer. You should not make investment decisions based solely on this information. Always do your own research and consult a qualified financial advisor.
By continuing, you acknowledge that you have read and agree to our full disclaimer & terms of use and privacy policy.