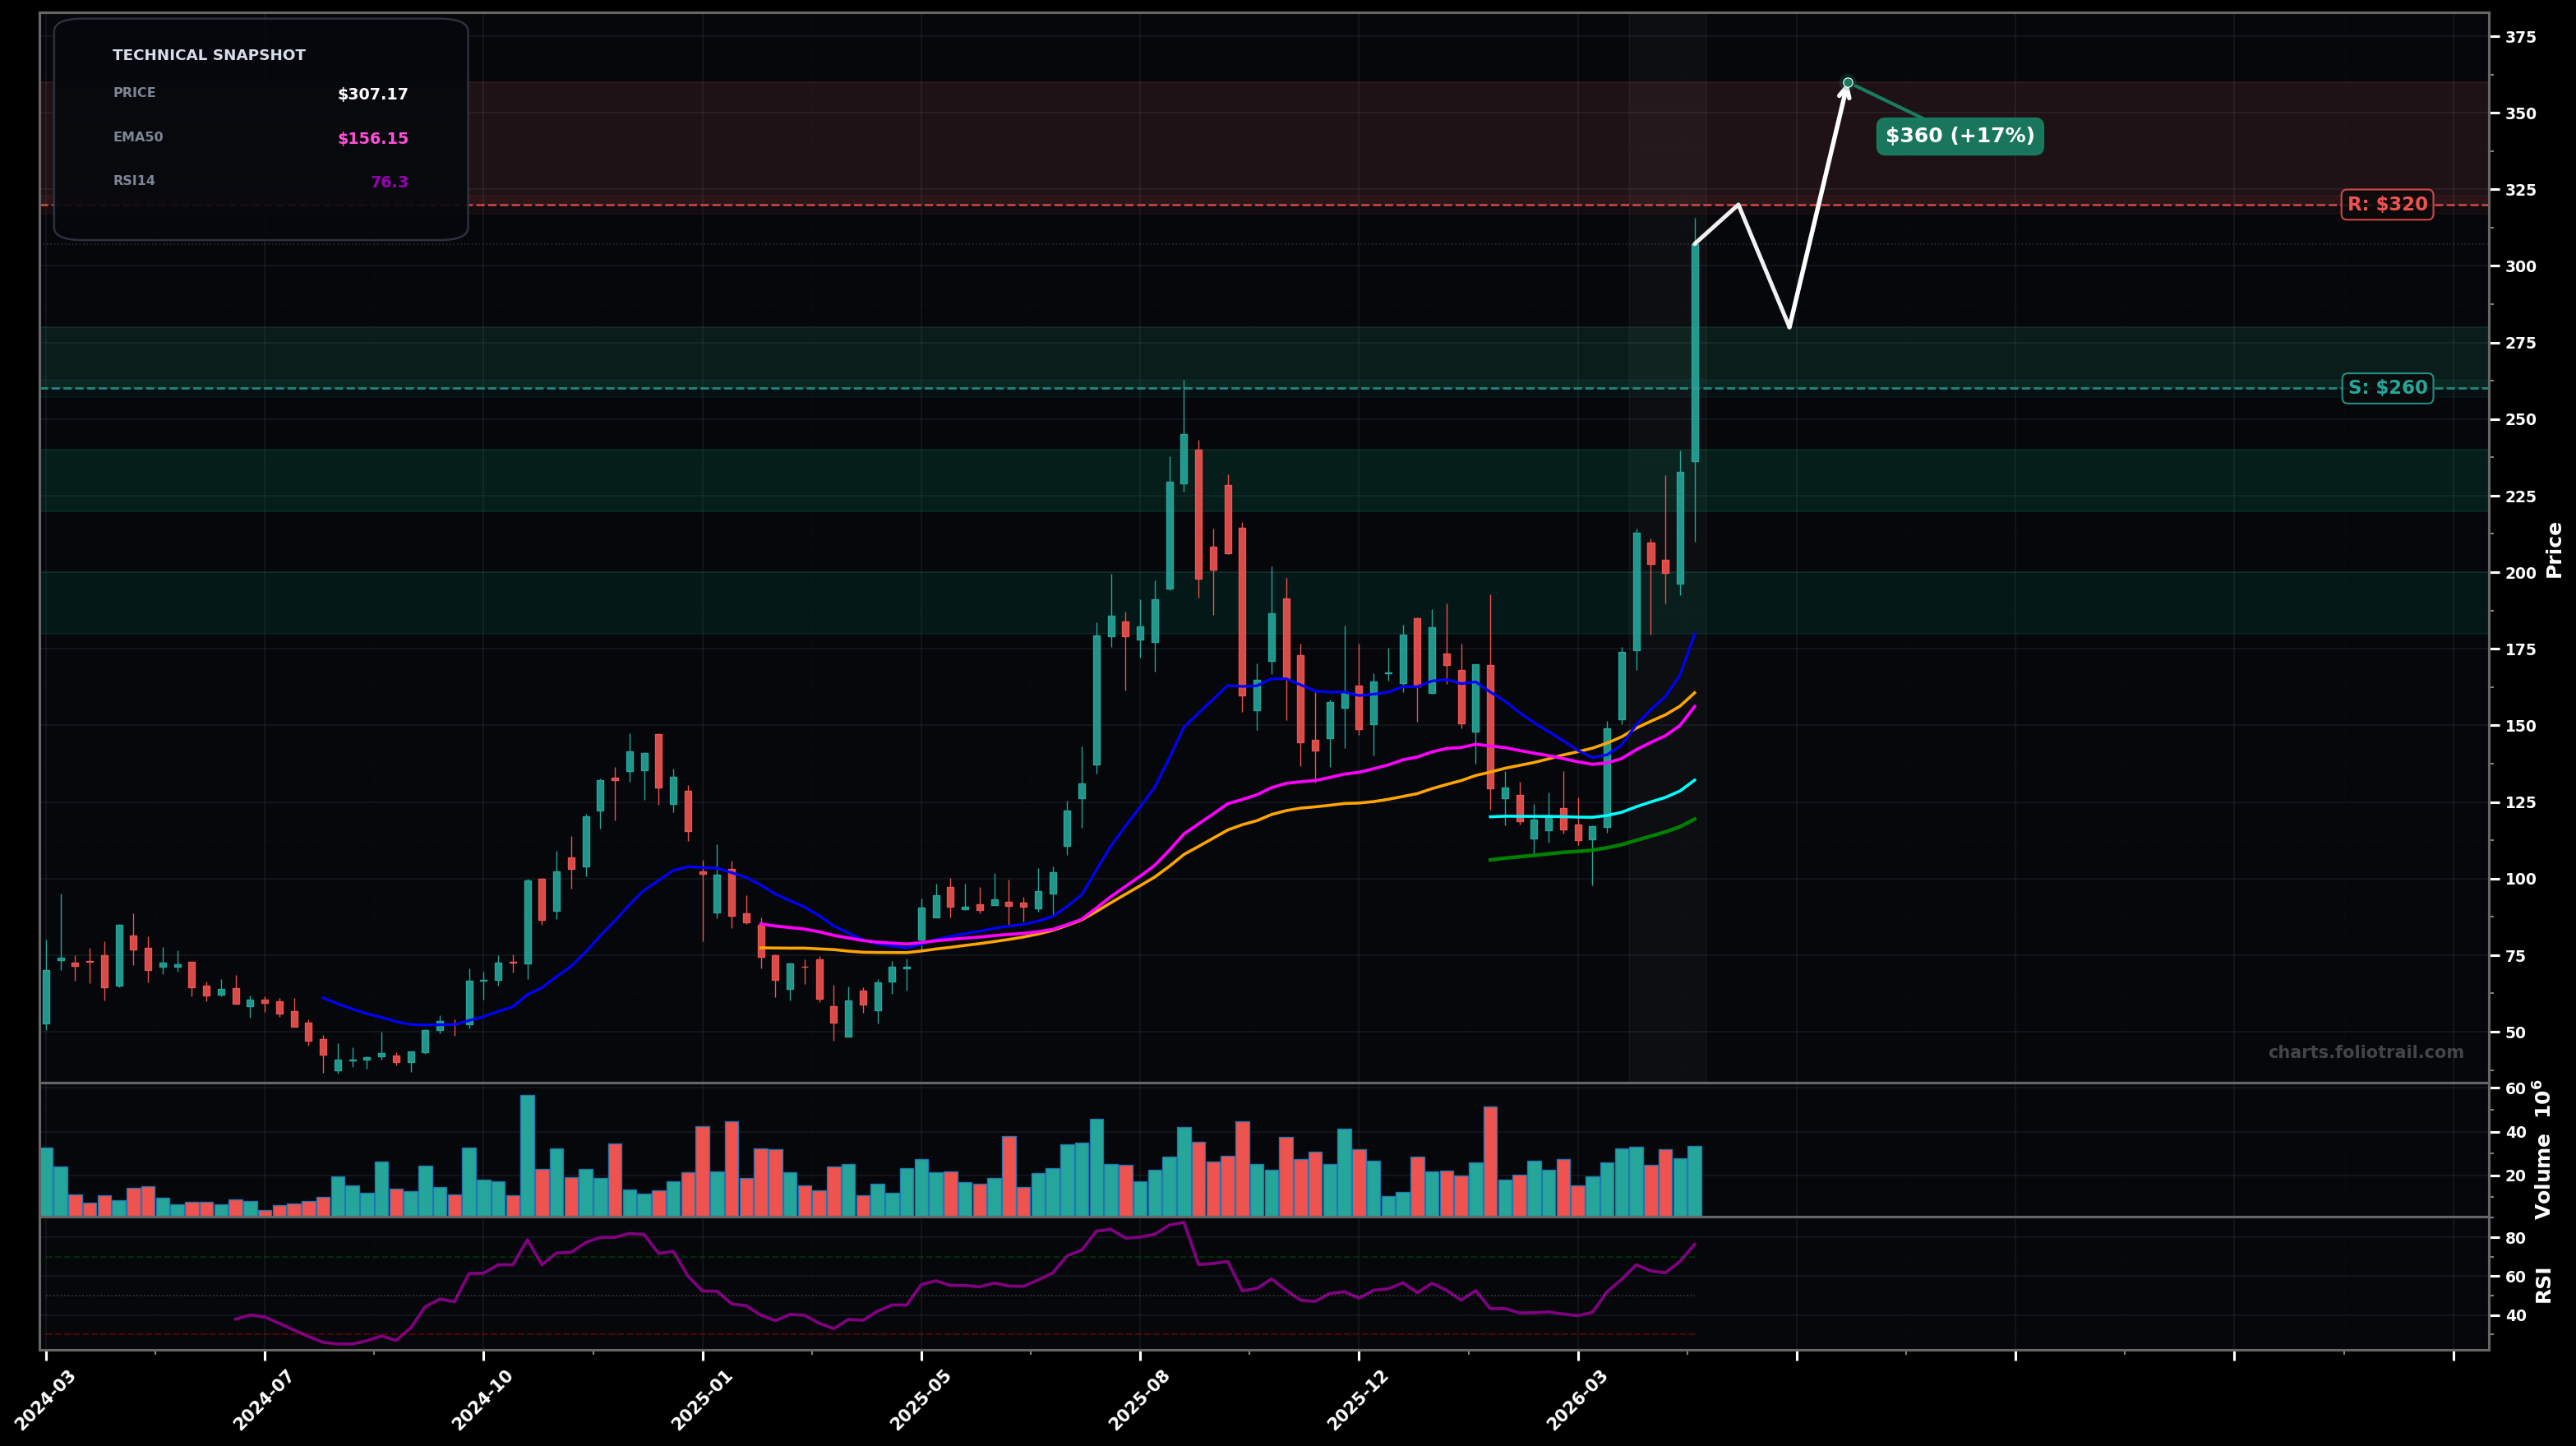
As of May 22, 2026, ALAB (ASTERA LABS INC COMMON STOCK (Ticker: 1ALAB)) is in a parabolic state on the weekly chart, with a confidence level of 74%. Key support is at $260 and key resistance at $320. Weekly breakout into a near-vertical advance; price at ~$307.17 is far above all key MAs with RSI-14 ~76 (overbought) and volatility/extension elevated.
Parabolic continuation (Elliott: wave 3/5 extension) with a brief digestion/pullback then push to new highs; likely a bull-flag type consolidation above prior breakout area.
Sharp mean-reversion as the parabolic leg exhausts (Elliott: wave 5 top or end of wave 3, followed by wave 4 correction) with a fast drop toward the prior breakout shelf before stabilizing.
2 weekly closes holding above $260
Weekly close back below $220
Buy-the-dip zones anchored to breakout retest ($260 area), then prior consolidation/MA-cluster magnet ($220–$240), then deeper reset toward higher-timeframe mean reversion and prior pivot support ($180–$200).
Trim into parabolic extensions (likely wave-5/late-wave upside) where RSI/price-to-EMA distance is extreme; progressively de-risk as upside becomes increasingly momentum-dependent.
As of May 22, 2026, ALAB (ASTERA LABS INC COMMON STOCK (Ticker: 1ALAB)) is in a parabolic state on the weekly chart with 74% confidence. Weekly breakout into a near-vertical advance; price at ~$307.17 is far above all key MAs with RSI-14 ~76 (overbought) and volatility/extension elevated.
On the weekly timeframe, ALAB has key support at $260 and key resistance at $320. The most likely scenario (bullish) targets $320 and $360, with a revert level at $280.
ALAB (ASTERA LABS INC COMMON STOCK (Ticker: 1ALAB)) is currently classified as parabolic on the weekly chart, with 74% confidence. Confirmation requires: 2 weekly closes holding above $260 This would be invalidated by: Weekly close back below $220
The most likely scenario (bullish) targets $320 and $360, with a revert level at $280. The alternative scenario (bearish) targets $240 and $200.
Multi-layer AI agents analyse 200+ stocks across daily, weekly, and monthly timeframes — producing market state classifications, price scenarios with targets, and position entry/exit levels. Daily charts updated every trading day at 6 PM ET. Weekly charts refresh Fridays. Monthly charts refresh on the last trading day of each month. No paywall. No sign-up required.
Built by Foliotrail.
All content on this website — including charts, analysis, price targets, support/resistance levels, and position zones — is generated entirely by AI and provided for educational and informational purposes only.
This is not financial advice. NEXUSNOIR VENTURES SL (the operator of this website) is not a registered investment adviser or broker-dealer. You should not make investment decisions based solely on this information. Always do your own research and consult a qualified financial advisor.
By continuing, you acknowledge that you have read and agree to our full disclaimer & terms of use and privacy policy.