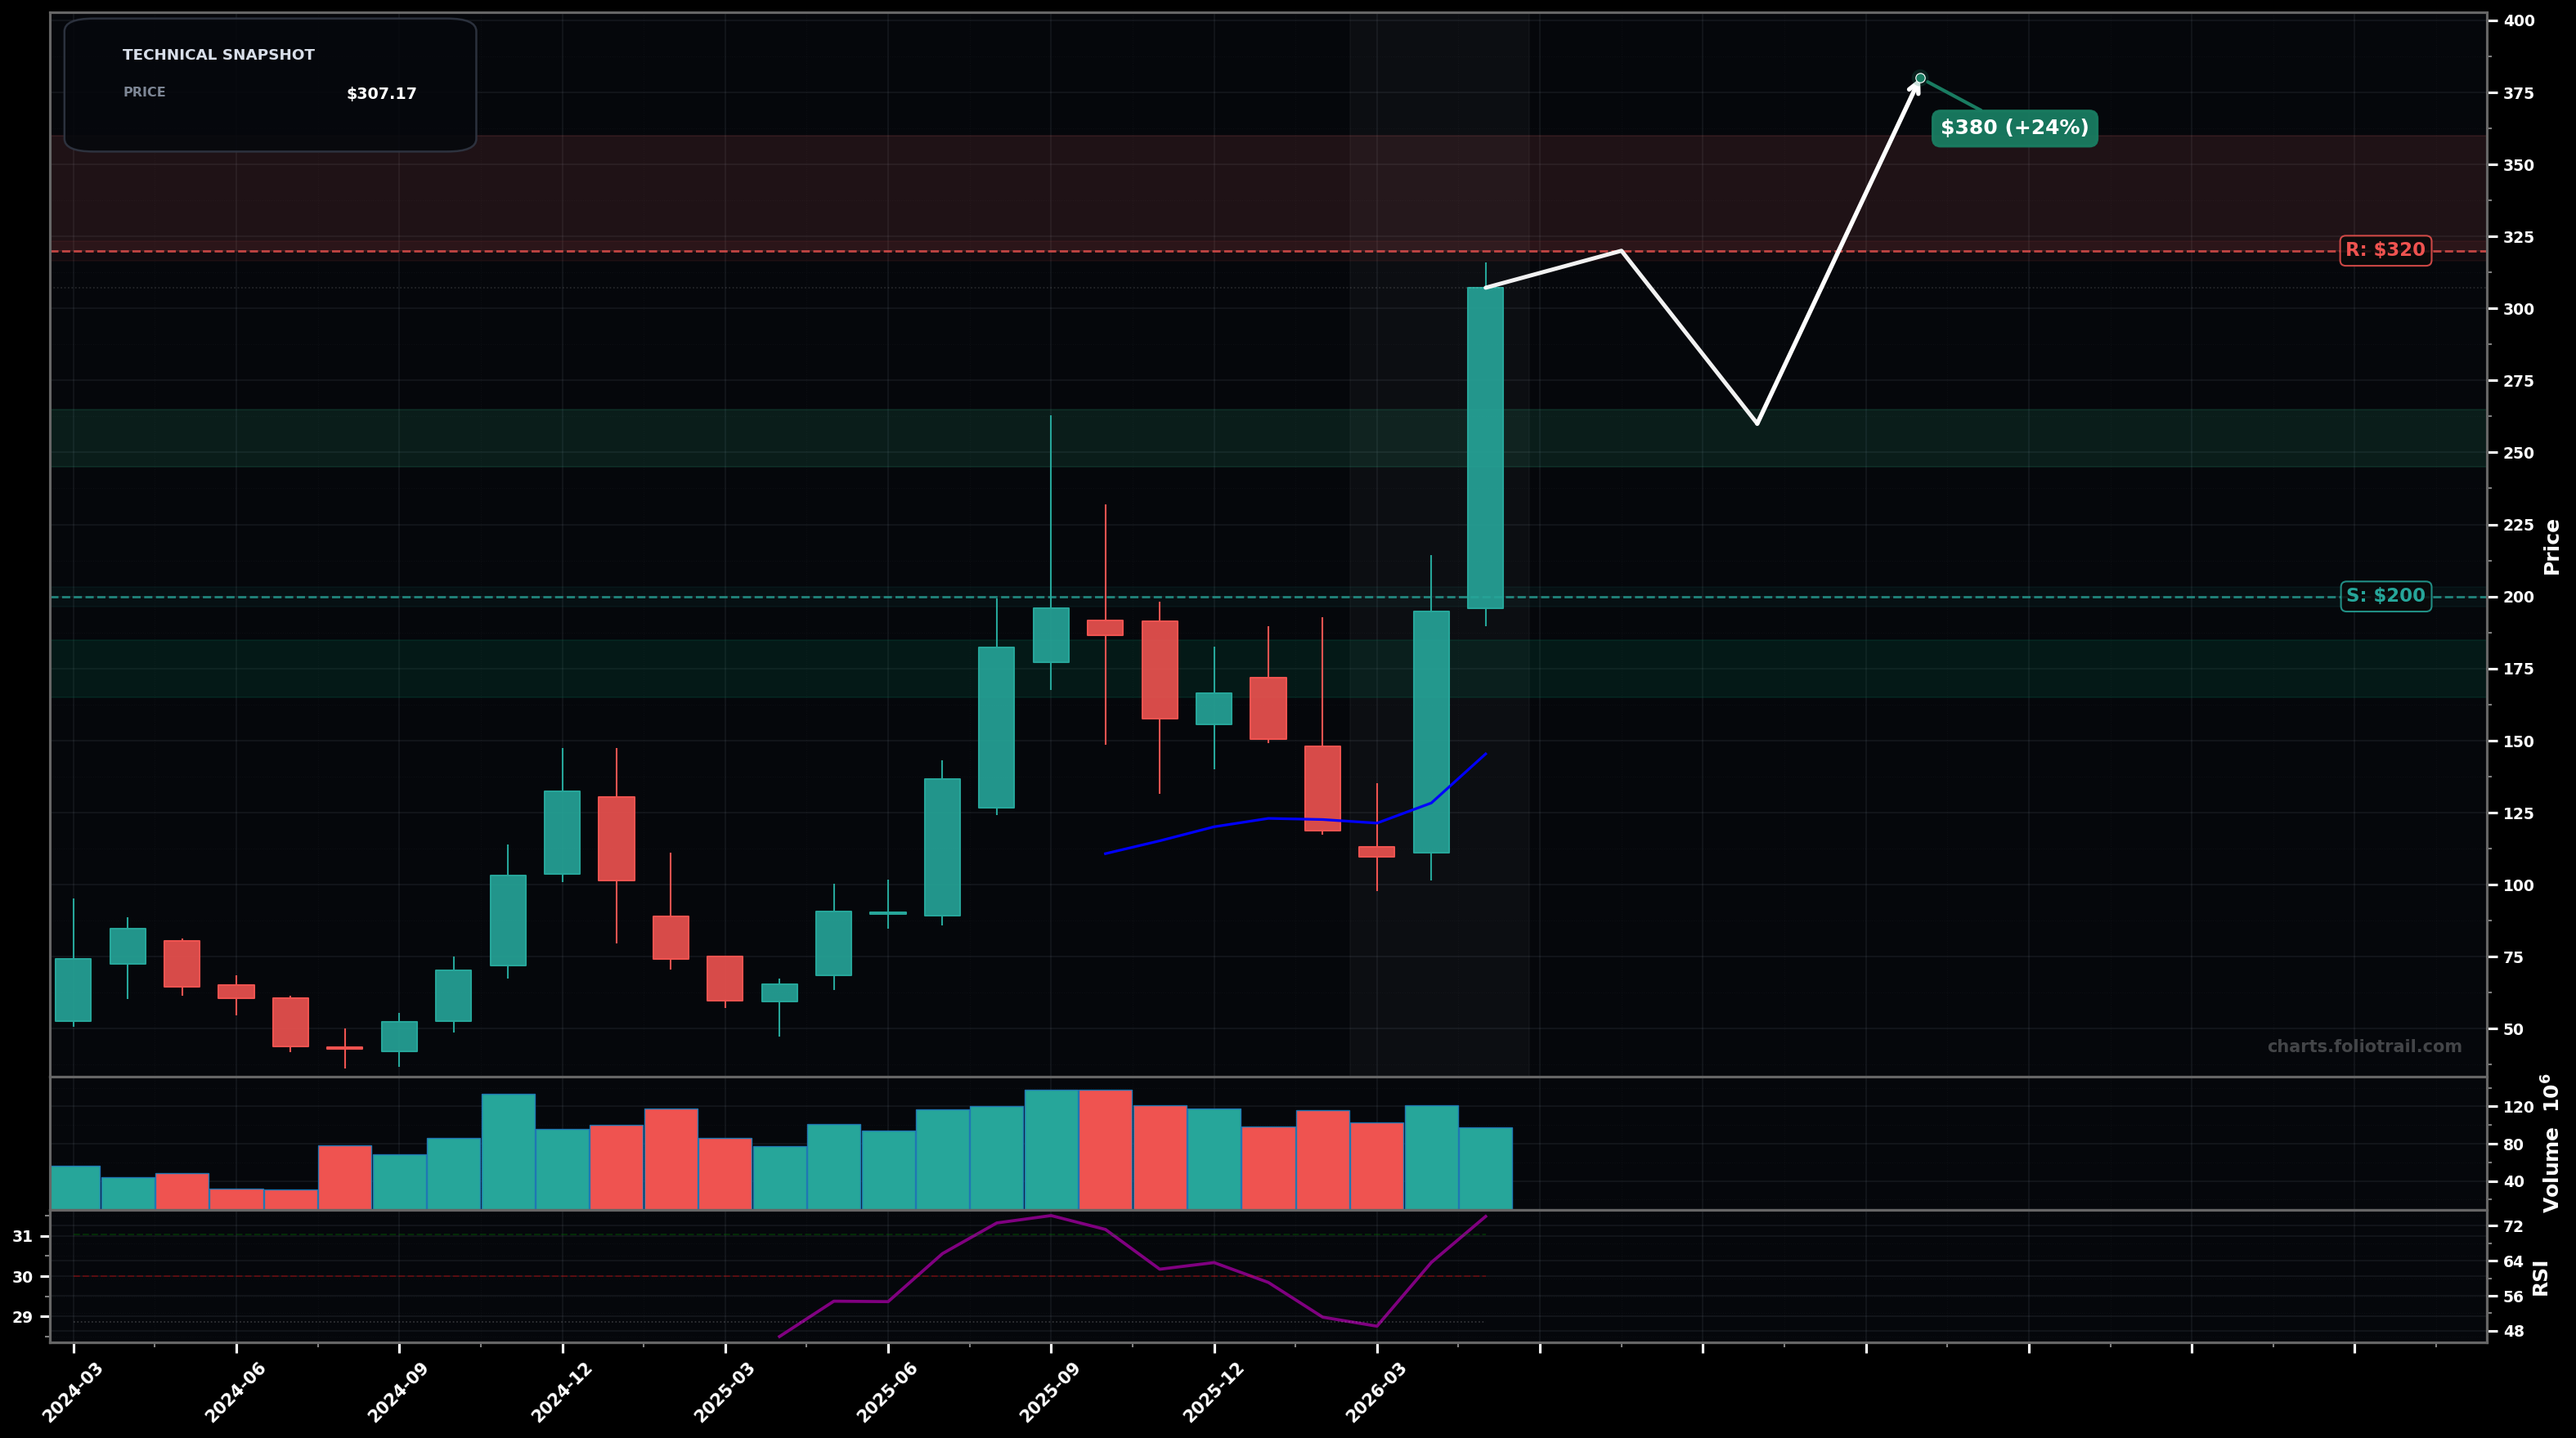
As of May 22, 2026, ALAB (ASTERA LABS INC COMMON STOCK (Ticker: 1ALAB)) is in a parabolic state on the monthly chart, with a confidence level of 72%. Key support is at $200 and key resistance at $320. Monthly breakout thrust to new highs with a very large green candle; price is far above rising EMA20 (~$145) and RSI is overbought (~74).
Continuation higher after brief consolidation: price digests the vertical move, then pushes to the next measured extension; fits an Elliott impulsive Wave 3/5 style thrust with only shallow pullbacks.
Mean-reversion / sharp pullback: post-blowoff volatility expands and price retraces toward the breakout base/last consolidation; typical of a Wave 4-type correction after a vertical impulse.
Another monthly close above $310 with follow-through (hold gains, no deep wick-down) would confirm parabolic continuation
Monthly close back below $250 would invalidate the parabolic continuation bias and favor a deeper mean-reversion
Buy zones are set at likely Fibonacci retrace pockets of the last impulse and prior breakout structure: ~0.236-0.382 (~$245-$265), ~0.5 (~$205-$225), and ~0.618 / EMA-mean reversion region (~$165-$185).
Trim into strength because price is in a parabolic/late-impulse regime: first into nearby extension/round-number resistance, more into higher Fibonacci extensions, and fully close if price reaches extreme multi-year stretch levels versus trend (high blow-off risk).
As of May 22, 2026, ALAB (ASTERA LABS INC COMMON STOCK (Ticker: 1ALAB)) is in a parabolic state on the monthly chart with 72% confidence. Monthly breakout thrust to new highs with a very large green candle; price is far above rising EMA20 (~$145) and RSI is overbought (~74).
On the monthly timeframe, ALAB has key support at $200 and key resistance at $320. The most likely scenario (bullish) targets $320 and $380, with a revert level at $260.
ALAB (ASTERA LABS INC COMMON STOCK (Ticker: 1ALAB)) is currently classified as parabolic on the monthly chart, with 72% confidence. Confirmation requires: Another monthly close above $310 with follow-through (hold gains, no deep wick-down) would confirm parabolic continuation This would be invalidated by: Monthly close back below $250 would invalidate the parabolic continuation bias and favor a deeper mean-reversion
The most likely scenario (bullish) targets $320 and $380, with a revert level at $260. The alternative scenario (bearish) targets $250 and $200.
Multi-layer AI agents analyse 200+ stocks across daily, weekly, and monthly timeframes — producing market state classifications, price scenarios with targets, and position entry/exit levels. Daily charts updated every trading day at 6 PM ET. Weekly charts refresh Fridays. Monthly charts refresh on the last trading day of each month. No paywall. No sign-up required.
Built by Foliotrail.
All content on this website — including charts, analysis, price targets, support/resistance levels, and position zones — is generated entirely by AI and provided for educational and informational purposes only.
This is not financial advice. NEXUSNOIR VENTURES SL (the operator of this website) is not a registered investment adviser or broker-dealer. You should not make investment decisions based solely on this information. Always do your own research and consult a qualified financial advisor.
By continuing, you acknowledge that you have read and agree to our full disclaimer & terms of use and privacy policy.