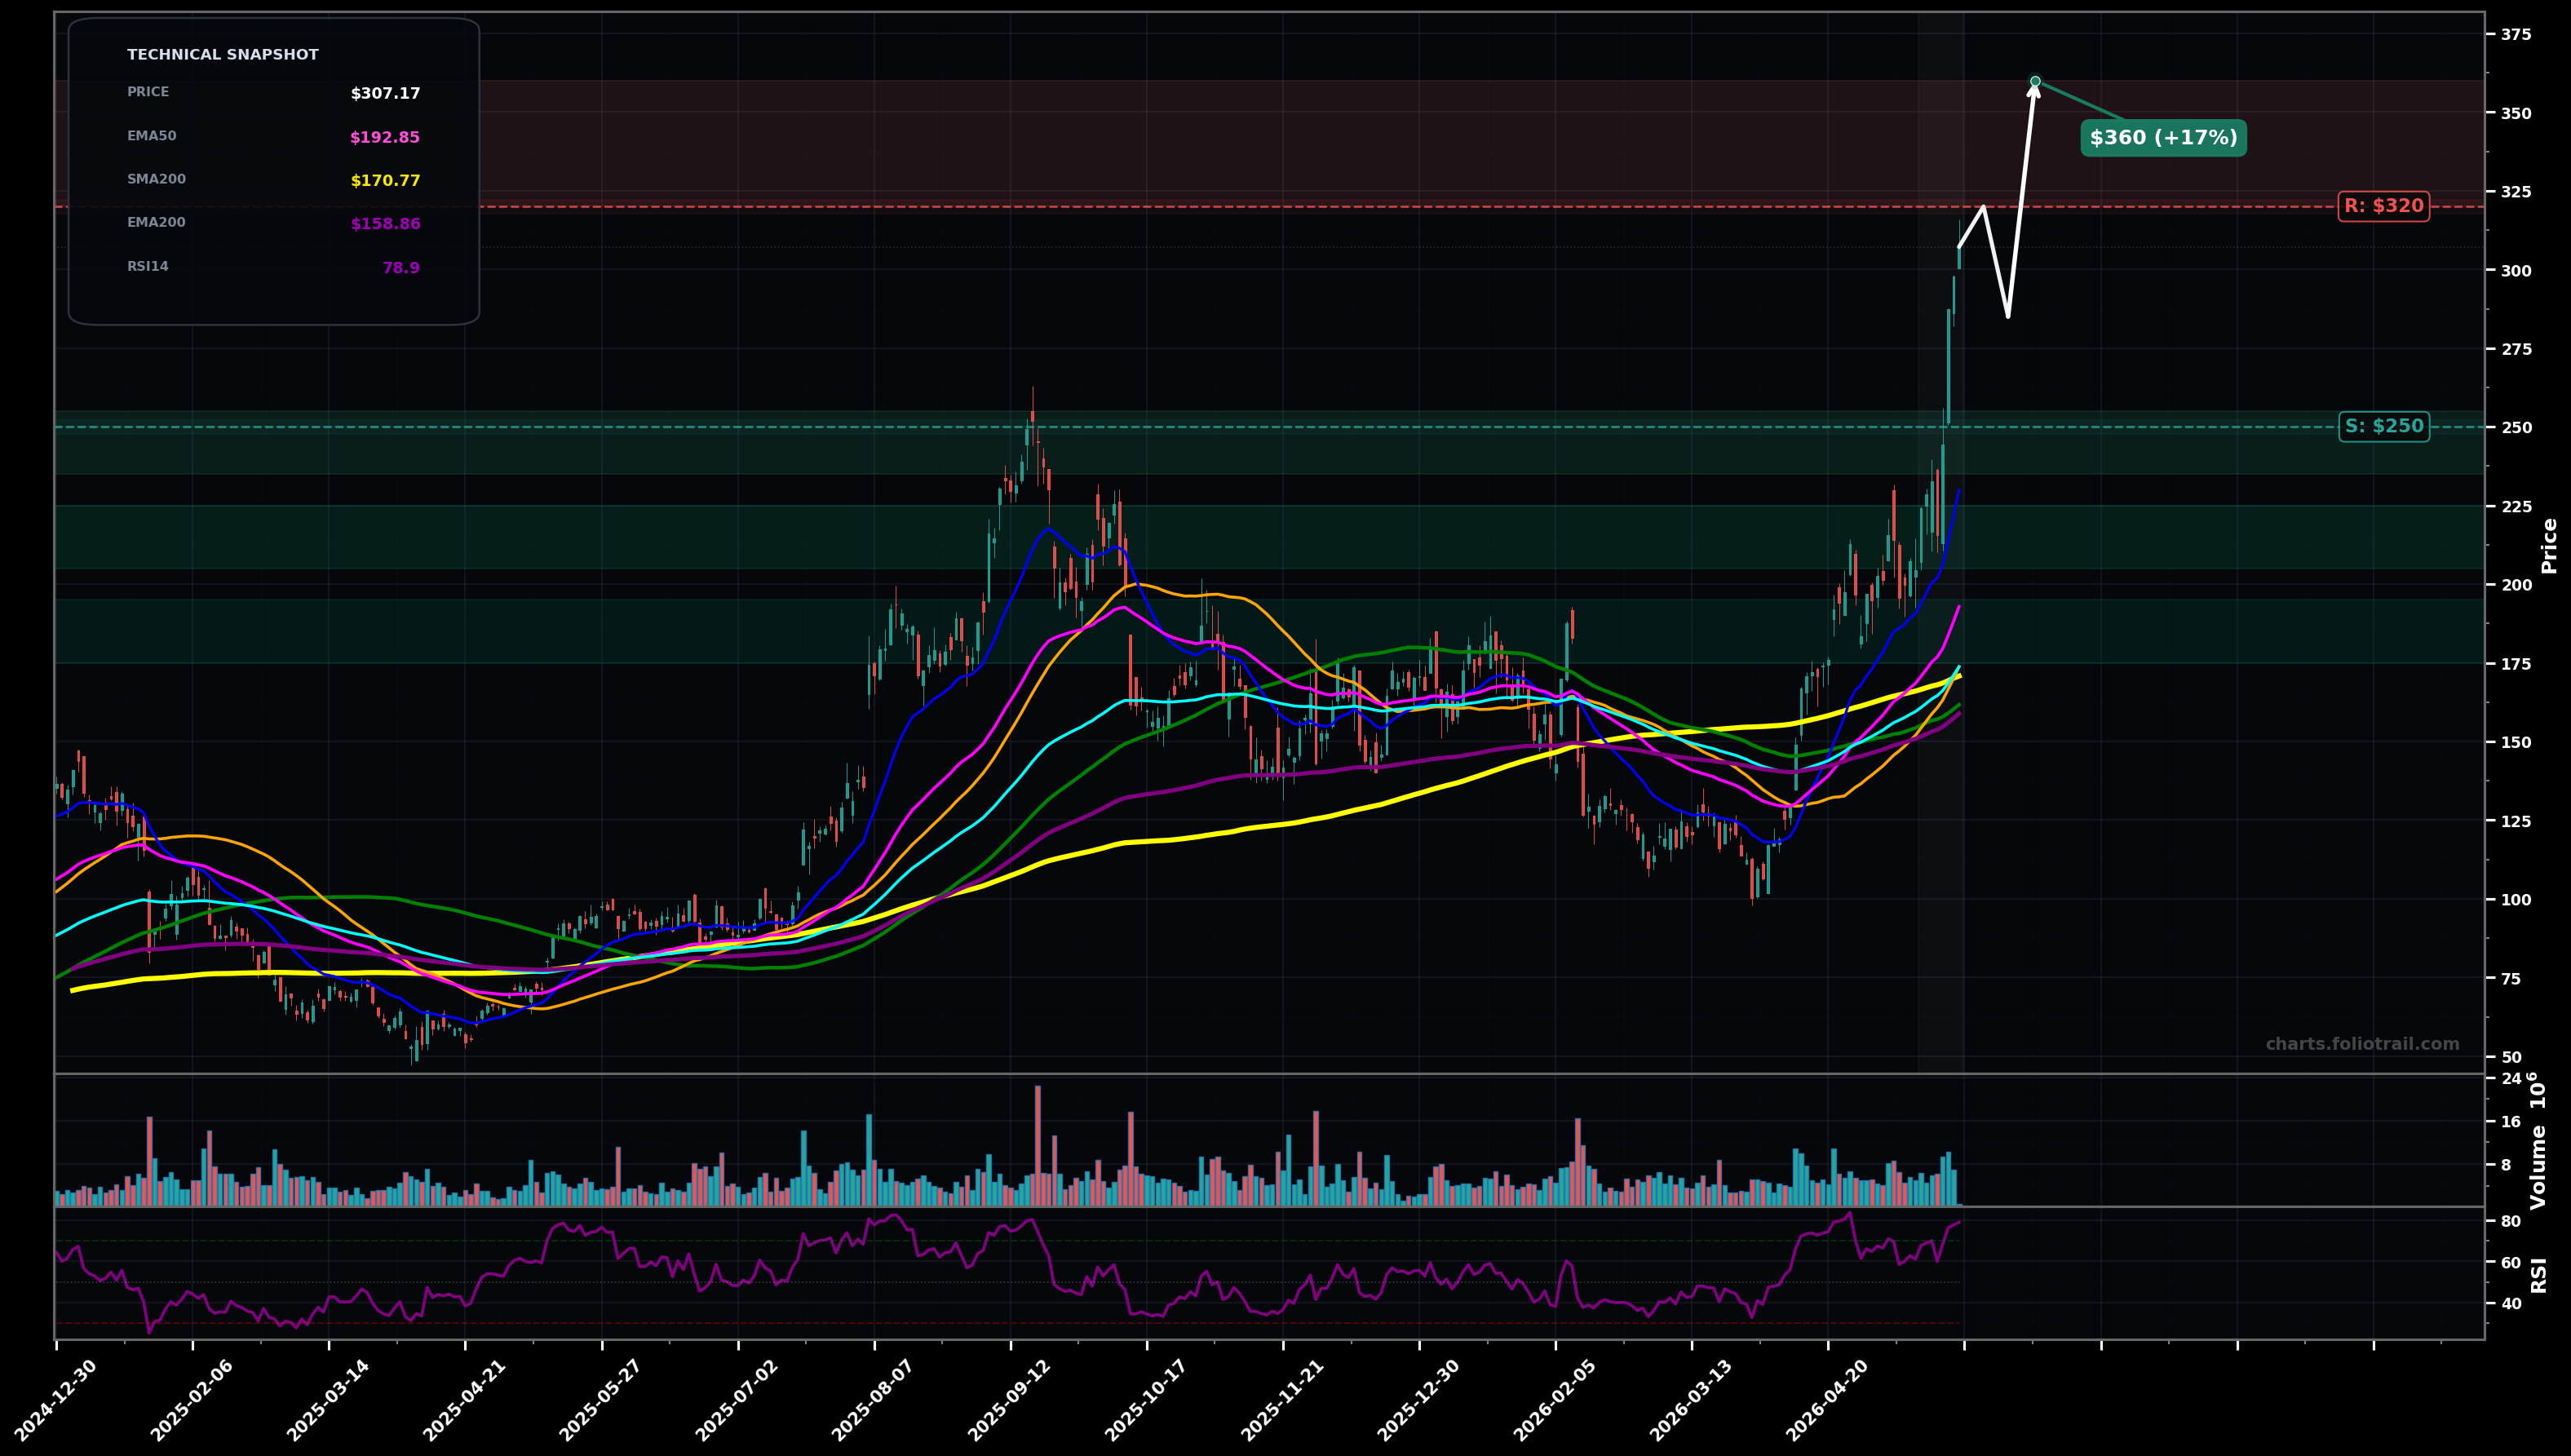
As of May 22, 2026, ALAB (ASTERA LABS INC COMMON STOCK (Ticker: 1ALAB)) is in a parabolic state on the daily chart, with a confidence level of 72%. Key support is at $250 and key resistance at $320. Explosive upside continuation with a breakout to new highs; price $307.17 far above all key MAs and RSI-14 ~79 (overbought momentum).
Parabolic continuation (likely Elliott Wave 5 extension) with a brief flag/pause, then a push into the low-$300s before a larger mean-reversion pullback begins.
Sharp mean-reversion / blow-off top risk: rejection near current highs followed by a fast pullback toward the breakout base and rising MAs (EMA20 then EMA50).
2+ daily closes holding above $290
Daily close back below $250
Prefer buying pullbacks: $235–$255 = prior breakout/round-number support; $205–$225 = mean-reversion toward EMA20/structure; $175–$195 aligns with EMA50 (~$192.85) and likely Fib retracement zone of the latest impulse.
Trim into strength while price is far above EMA50/EMA100 and RSI is overheated; higher trim bands assume continued Wave-5/Fib extension where reversal risk grows materially.
As of May 22, 2026, ALAB (ASTERA LABS INC COMMON STOCK (Ticker: 1ALAB)) is in a parabolic state on the daily chart with 72% confidence. Explosive upside continuation with a breakout to new highs; price $307.17 far above all key MAs and RSI-14 ~79 (overbought momentum).
On the daily timeframe, ALAB has key support at $250 and key resistance at $320. The most likely scenario (bullish) targets $320 and $360, with a revert level at $285.
ALAB (ASTERA LABS INC COMMON STOCK (Ticker: 1ALAB)) is currently classified as parabolic on the daily chart, with 72% confidence. Confirmation requires: 2+ daily closes holding above $290 This would be invalidated by: Daily close back below $250
The most likely scenario (bullish) targets $320 and $360, with a revert level at $285. The alternative scenario (bearish) targets $260 and $205.
Multi-layer AI agents analyse 200+ stocks across daily, weekly, and monthly timeframes — producing market state classifications, price scenarios with targets, and position entry/exit levels. Daily charts updated every trading day at 6 PM ET. Weekly charts refresh Fridays. Monthly charts refresh on the last trading day of each month. No paywall. No sign-up required.
Built by Foliotrail.
All content on this website — including charts, analysis, price targets, support/resistance levels, and position zones — is generated entirely by AI and provided for educational and informational purposes only.
This is not financial advice. NEXUSNOIR VENTURES SL (the operator of this website) is not a registered investment adviser or broker-dealer. You should not make investment decisions based solely on this information. Always do your own research and consult a qualified financial advisor.
By continuing, you acknowledge that you have read and agree to our full disclaimer & terms of use and privacy policy.