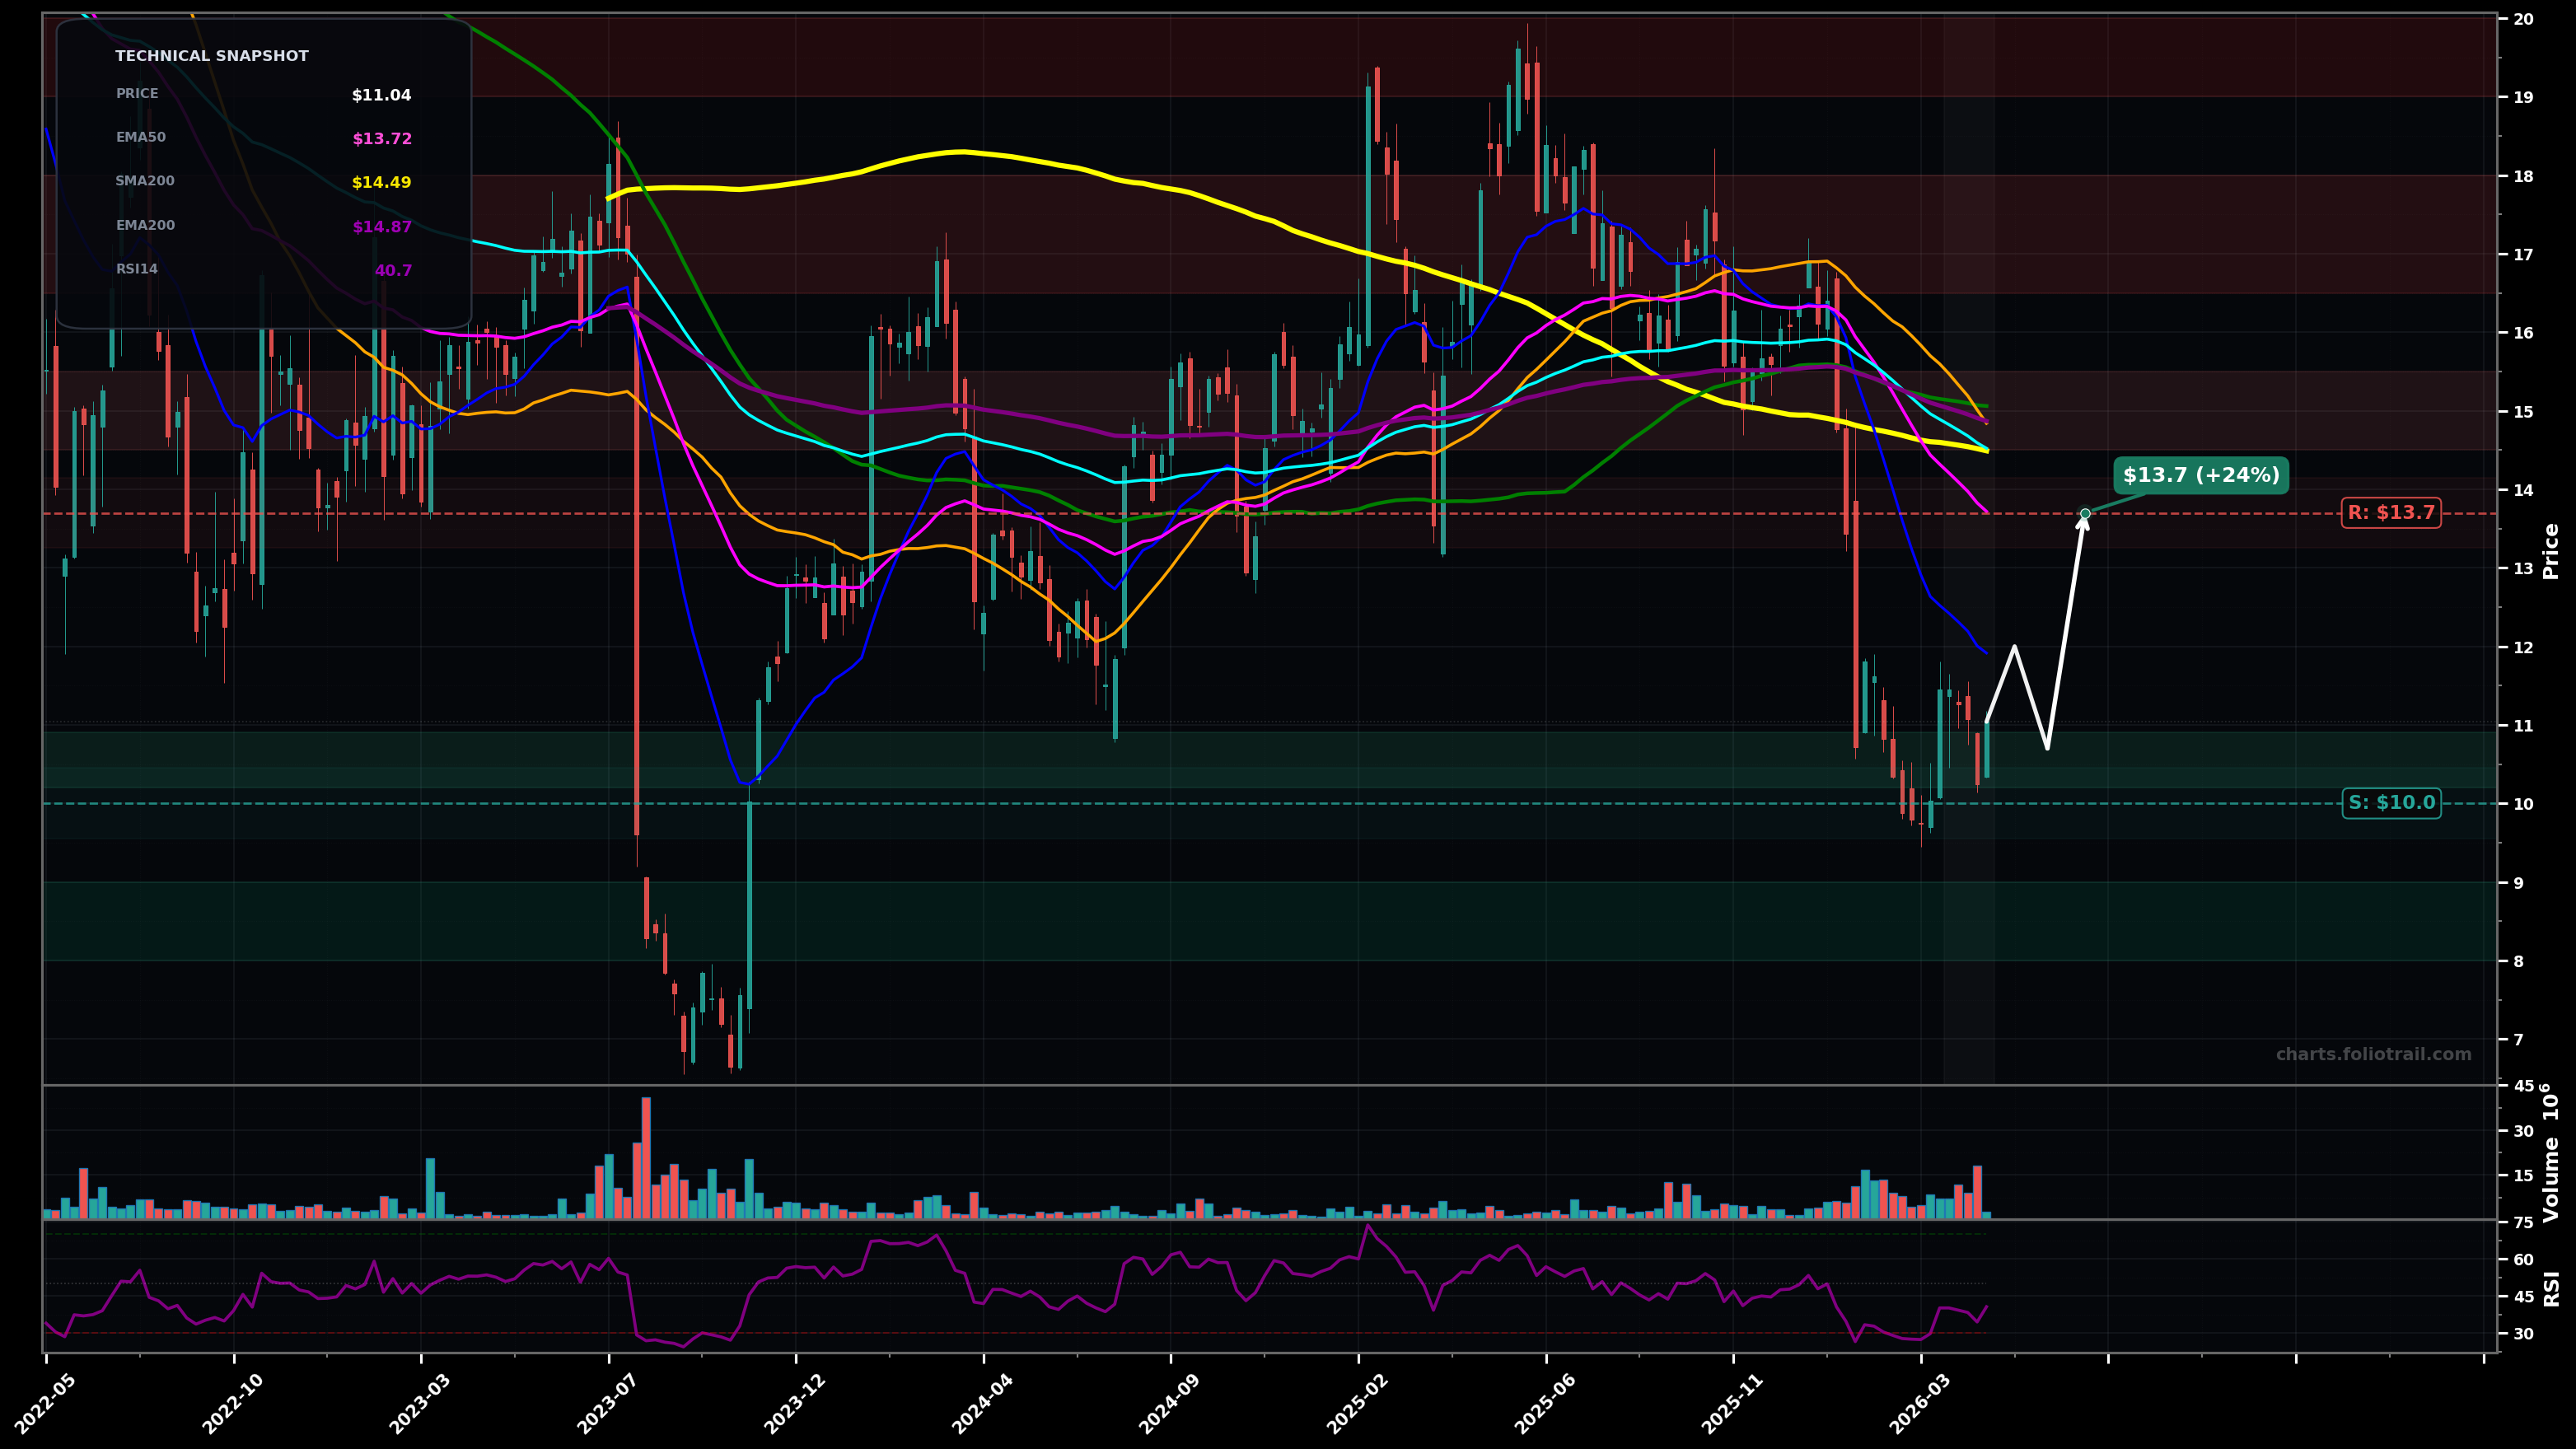
As of May 22, 2026, ADYEY (Adyen N.V. ADR) is in a falling knife state on the weekly chart, with a confidence level of 72%. Key support is at $10.0 and key resistance at $13.7. Sharp breakdown to ~$10–$11 zone after losing the $14–$15 MA cluster; small bounce attempt with RSI ~41 but price still below key averages.
Base-building / dead-cat bounce: price holds the ~$10 pivot, then mean-reverts toward the first heavy resistance at EMA50/MA cluster; upside likely capped unless $13.7 is reclaimed and held.
Continuation leg down: failure to hold ~$10 leads to a quick flush (wave C / wave 3-style extension) toward the next psychological support zone, with only brief rebounds.
Weekly close below $10.00 (follow-through under the recent swing low).
Two consecutive weekly closes back above $13.70 (reclaim/hold EMA50).
Entries staged around the swing-low support ($10) and likely fib/psych flush zones ($9/$8) while price remains below the falling $13.7–$15 MA resistance band.
Trim into the overhead MA supply zone first ($14.5–$15.5), then prior distribution/resistance ($16.5–$18), and consider full exit into the prior major swing-high area ($19–$20) if reached.
As of May 22, 2026, ADYEY (Adyen N.V. ADR) is in a falling knife state on the weekly chart with 72% confidence. Sharp breakdown to ~$10–$11 zone after losing the $14–$15 MA cluster; small bounce attempt with RSI ~41 but price still below key averages.
On the weekly timeframe, ADYEY has key support at $10.0 and key resistance at $13.7. The most likely scenario (bullish) targets $12.0 and $13.7, with a revert level at $10.7.
ADYEY (Adyen N.V. ADR) is currently classified as falling knife on the weekly chart, with 72% confidence. Confirmation requires: Weekly close below $10.00 (follow-through under the recent swing low). This would be invalidated by: Two consecutive weekly closes back above $13.70 (reclaim/hold EMA50).
The most likely scenario (bullish) targets $12.0 and $13.7, with a revert level at $10.7. The alternative scenario (bearish) targets $9.00 and $8.00.
Multi-layer AI agents analyse 200+ stocks across daily, weekly, and monthly timeframes — producing market state classifications, price scenarios with targets, and position entry/exit levels. Daily charts updated every trading day at 6 PM ET. Weekly charts refresh Fridays. Monthly charts refresh on the last trading day of each month. No paywall. No sign-up required.
Built by Foliotrail.
All content on this website — including charts, analysis, price targets, support/resistance levels, and position zones — is generated entirely by AI and provided for educational and informational purposes only.
This is not financial advice. NEXUSNOIR VENTURES SL (the operator of this website) is not a registered investment adviser or broker-dealer. You should not make investment decisions based solely on this information. Always do your own research and consult a qualified financial advisor.
By continuing, you acknowledge that you have read and agree to our full disclaimer & terms of use and privacy policy.