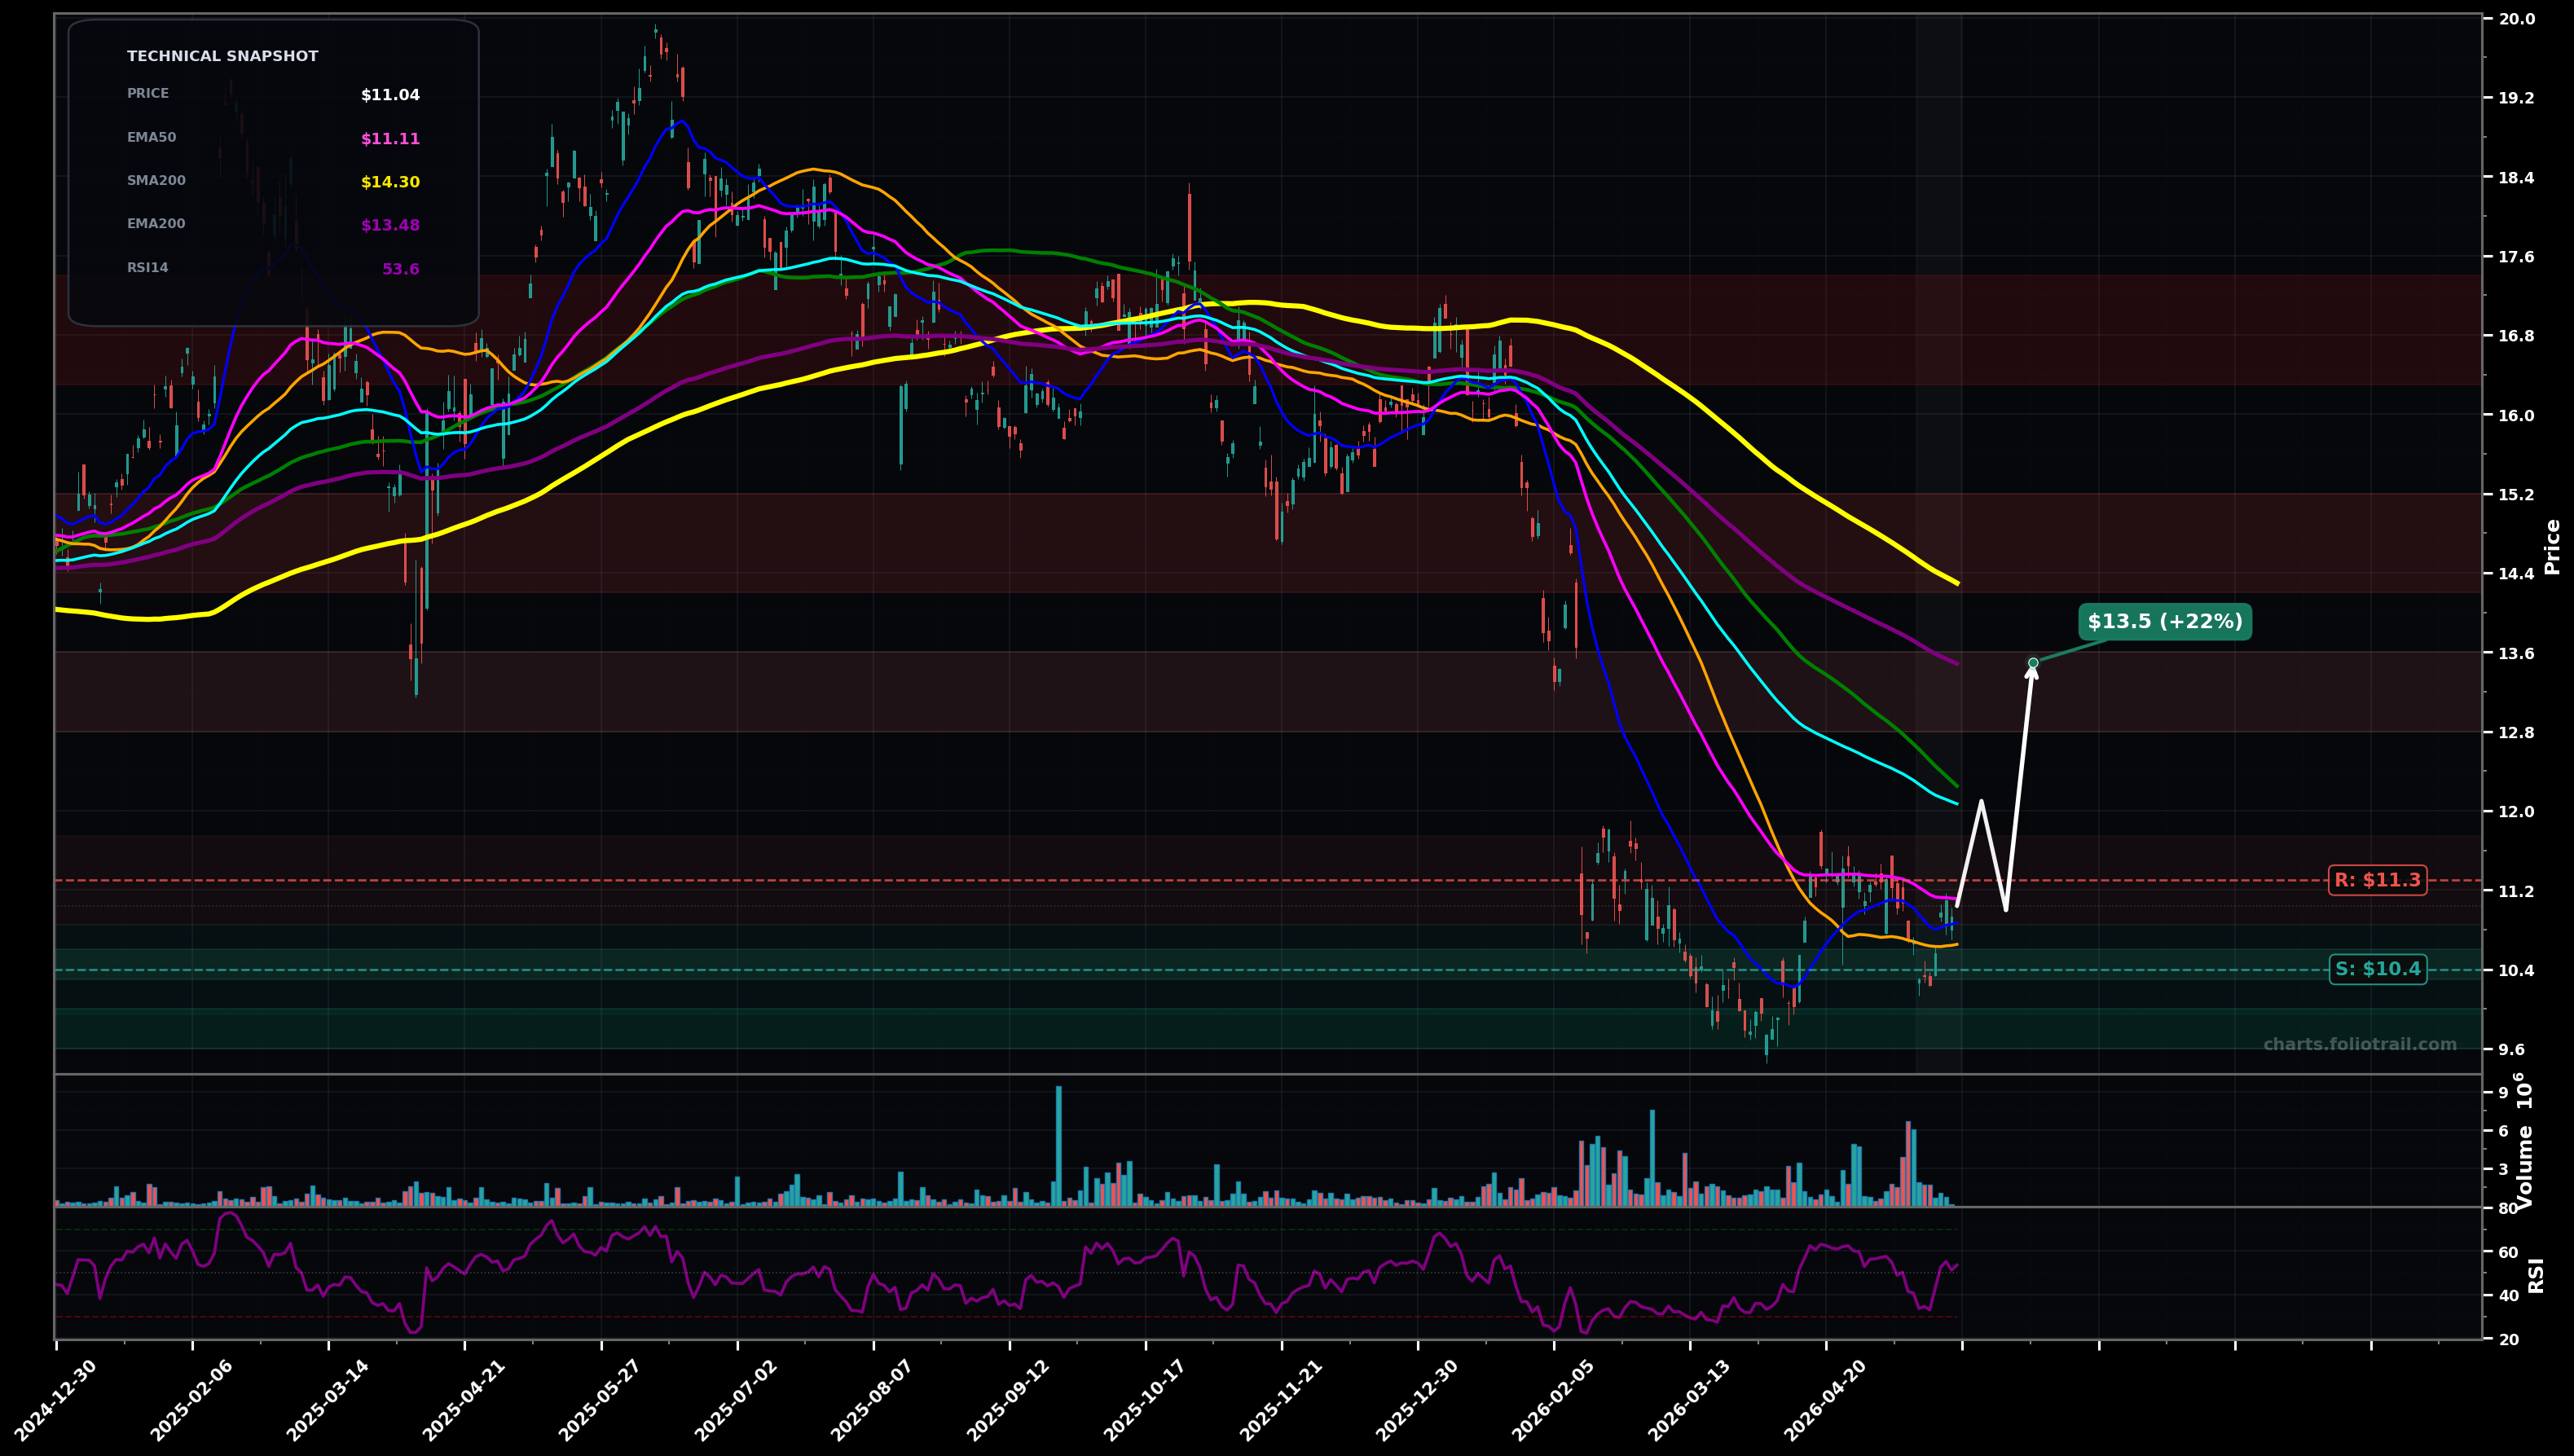
As of May 22, 2026, ADYEY (Adyen N.V. ADR) is in a bottoming attempt state on the daily chart, with a confidence level of 62%. Key support is at $10.4 and key resistance at $11.3. Sharp selloff into ~$9.7 followed by a rebound and tight consolidation around ~$11, with price still below the falling EMA50/EMA100 cluster.
Base-building continues; price holds above ~$10.4, grinds above the EMA50 area and attempts a mean-reversion push toward the next overhead MAs/Fib retrace zone.
Bear flag resolves lower; rejection at ~$11.3–$11.5 and breakdown below ~$10.4 leads to a retest of the March low and possibly an extension.
2+ daily closes above $11.25 with follow-through toward $12.00 (clearing the near-term MA cluster)
Daily close below $9.70 (breaks the swing-low reference and reopens the downtrend leg)
Start near prior consolidation/support (~$10.4) and EMA20 area; add on confirmed breakdown/retest toward the swing low (~$9.7); heavy add only if capitulation/extension toward the next psychological/support zone (~$9).
Trim into likely mean-reversion resistance layers: ~$13.5 aligns with overhead MA supply (EMA200 ~ $13.5), ~$14.3 is near SMA200, and ~$16.5–$17.4 is the prior breakdown/supply region where larger Elliott Wave corrective rallies often fail.
As of May 22, 2026, ADYEY (Adyen N.V. ADR) is in a bottoming attempt state on the daily chart with 62% confidence. Sharp selloff into ~$9.7 followed by a rebound and tight consolidation around ~$11, with price still below the falling EMA50/EMA100 cluster.
On the daily timeframe, ADYEY has key support at $10.4 and key resistance at $11.3. The most likely scenario (bullish) targets $12.1 and $13.5, with a revert level at $11.0.
ADYEY (Adyen N.V. ADR) is currently classified as bottoming attempt on the daily chart, with 62% confidence. Confirmation requires: 2+ daily closes above $11.25 with follow-through toward $12.00 (clearing the near-term MA cluster) This would be invalidated by: Daily close below $9.70 (breaks the swing-low reference and reopens the downtrend leg)
The most likely scenario (bullish) targets $12.1 and $13.5, with a revert level at $11.0. The alternative scenario (bearish) targets $9.70 and $9.00.
Multi-layer AI agents analyse 200+ stocks across daily, weekly, and monthly timeframes — producing market state classifications, price scenarios with targets, and position entry/exit levels. Daily charts updated every trading day at 6 PM ET. Weekly charts refresh Fridays. Monthly charts refresh on the last trading day of each month. No paywall. No sign-up required.
Built by Foliotrail.
All content on this website — including charts, analysis, price targets, support/resistance levels, and position zones — is generated entirely by AI and provided for educational and informational purposes only.
This is not financial advice. NEXUSNOIR VENTURES SL (the operator of this website) is not a registered investment adviser or broker-dealer. You should not make investment decisions based solely on this information. Always do your own research and consult a qualified financial advisor.
By continuing, you acknowledge that you have read and agree to our full disclaimer & terms of use and privacy policy.